Dashboard Data Perspectives: Dynamic Filter
Overview
Each dashboard provides a view of the data configured in it in the form of metrics and indicators. And it’s intended for a specific audience like an engineering team, a leadership board, or a technical support department. However, there are different perspectives to that dashboard if the user (who is viewing it) wants to highlight the metrics and indicators by client, project, or another concept.
A Dynamic Filter is personal and customized to a specific user, so the filter will be saved, and the dashboard will filter the same view the next time that user opens it.
Dynamic Filter

In the top bar of the dashboard, you find the “Filters” option that opens the Dynamic Filter bar. You can select projects, types, statuses, assignees, and/or free text to filter the gadgets in the dashboard dynamically.
To clear the selection of filters, just click “Clear”, and all the selected options will be removed.
While the Dynamic Filter bar is open, the gadgets affected by the current filter are highlighted by a blue border, so it’s easier to understand the scope of the filters:
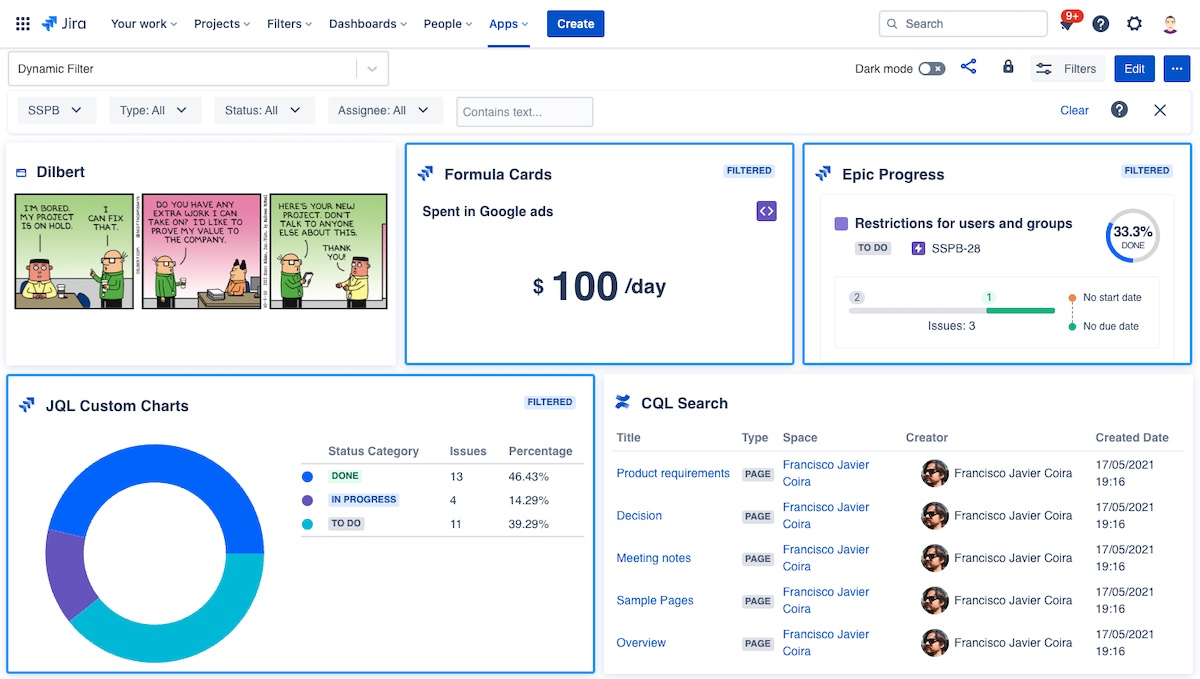
The highlighted gadgets indicate that the current filter affects them.
Individually filtered gadgets
In case the user wants to filter only a sub-set of gadgets when hovering a filtered gadget, a toggle “Filter” appears. If you disable it, the content of that gadget won’t be affected by the Dynamic Filter:
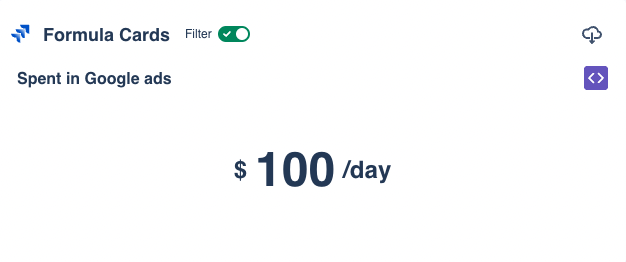
Filter enabled for this gadget
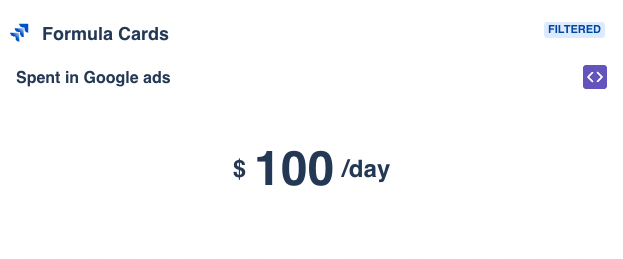
The status “Filtered” indicates that there’s an active filter
Currently supported products
Current version only supports local Jira instances. We are working on supporting external instances, keep an eye on this page.
- Jira Work Management
- Jira Software
- Jira Service Management
- Insight
- StatusPage
- Opsgenie
- Confluence
- Projectrak
- Bitbucket
- Atlassian Marketplace
Currently supported fields
- Project
- Type
- Status
- Assignee
- Search free text
See also
- Set Up a Wallboard
Set up your information radiator: A wallboard
- Create, Edit, Clone, Delete and Export your Dashboard
Easily create and edit your dashboard layout, add gadgets, set access restrictions or share it
- What is a Dashboard?
A dashboard is a visualization tool that helps your team to track their work: Monitor environments, visualize sales, detect incidents, analyze performance, track projects and so on.
- How to Build your Central Data Hub
Centralize your data by turning Jira and Confluence into the Central Data Hub of your organization