Create, Edit, Clone, Delete and Export your Dashboard
Overview
Create and edit dashboards is very simple, learn to organize the right metrics to transmit quick feedback to your team.
Create a dashboard
You can quickly create your own dashboard to display the information your team and you need:
At the top right select the … menu
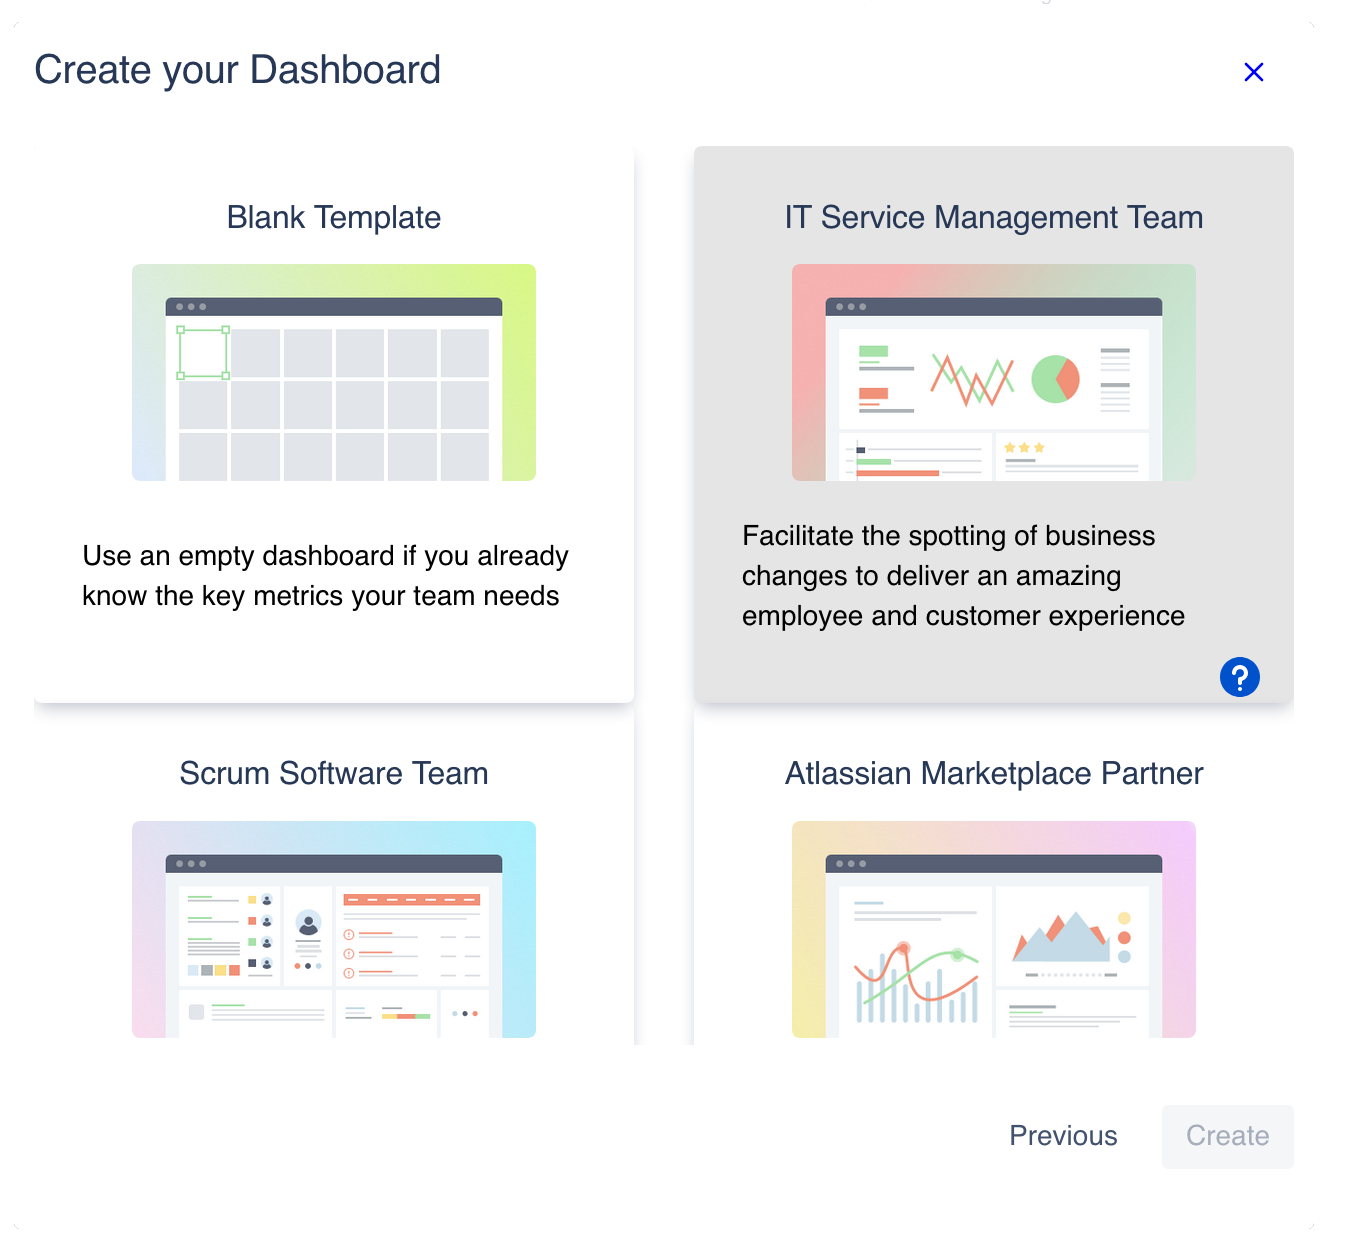
Select Create Dashboard to create a blank dashboard or use one of the provided templates.
Fill out the Name, Description and set the Access restriction for your dashboard.
In the next screen, select whether you want to start with a blank template or select one of the provided templates.
Click Create.
Use a template
If you chose one of the available templates (see Dashboard Templates: Teams and Use Cases) you’ll have several gadgets in your dashboard panel. These gadgets are selected based on the team the dashboard is intended for. Configure your gadgets (see https://roninpixels.atlassian.net/wiki/pages/resumedraft.action?draftId=87261228) or keep on adding more (see next section).
Add gadgets
To complete your dashboard panel setup with KPIs and metrics, while the edition mode, remember, click on the Edit button in the right top navigation bar, you’ll see new controls in the middle of the top navigation bar:
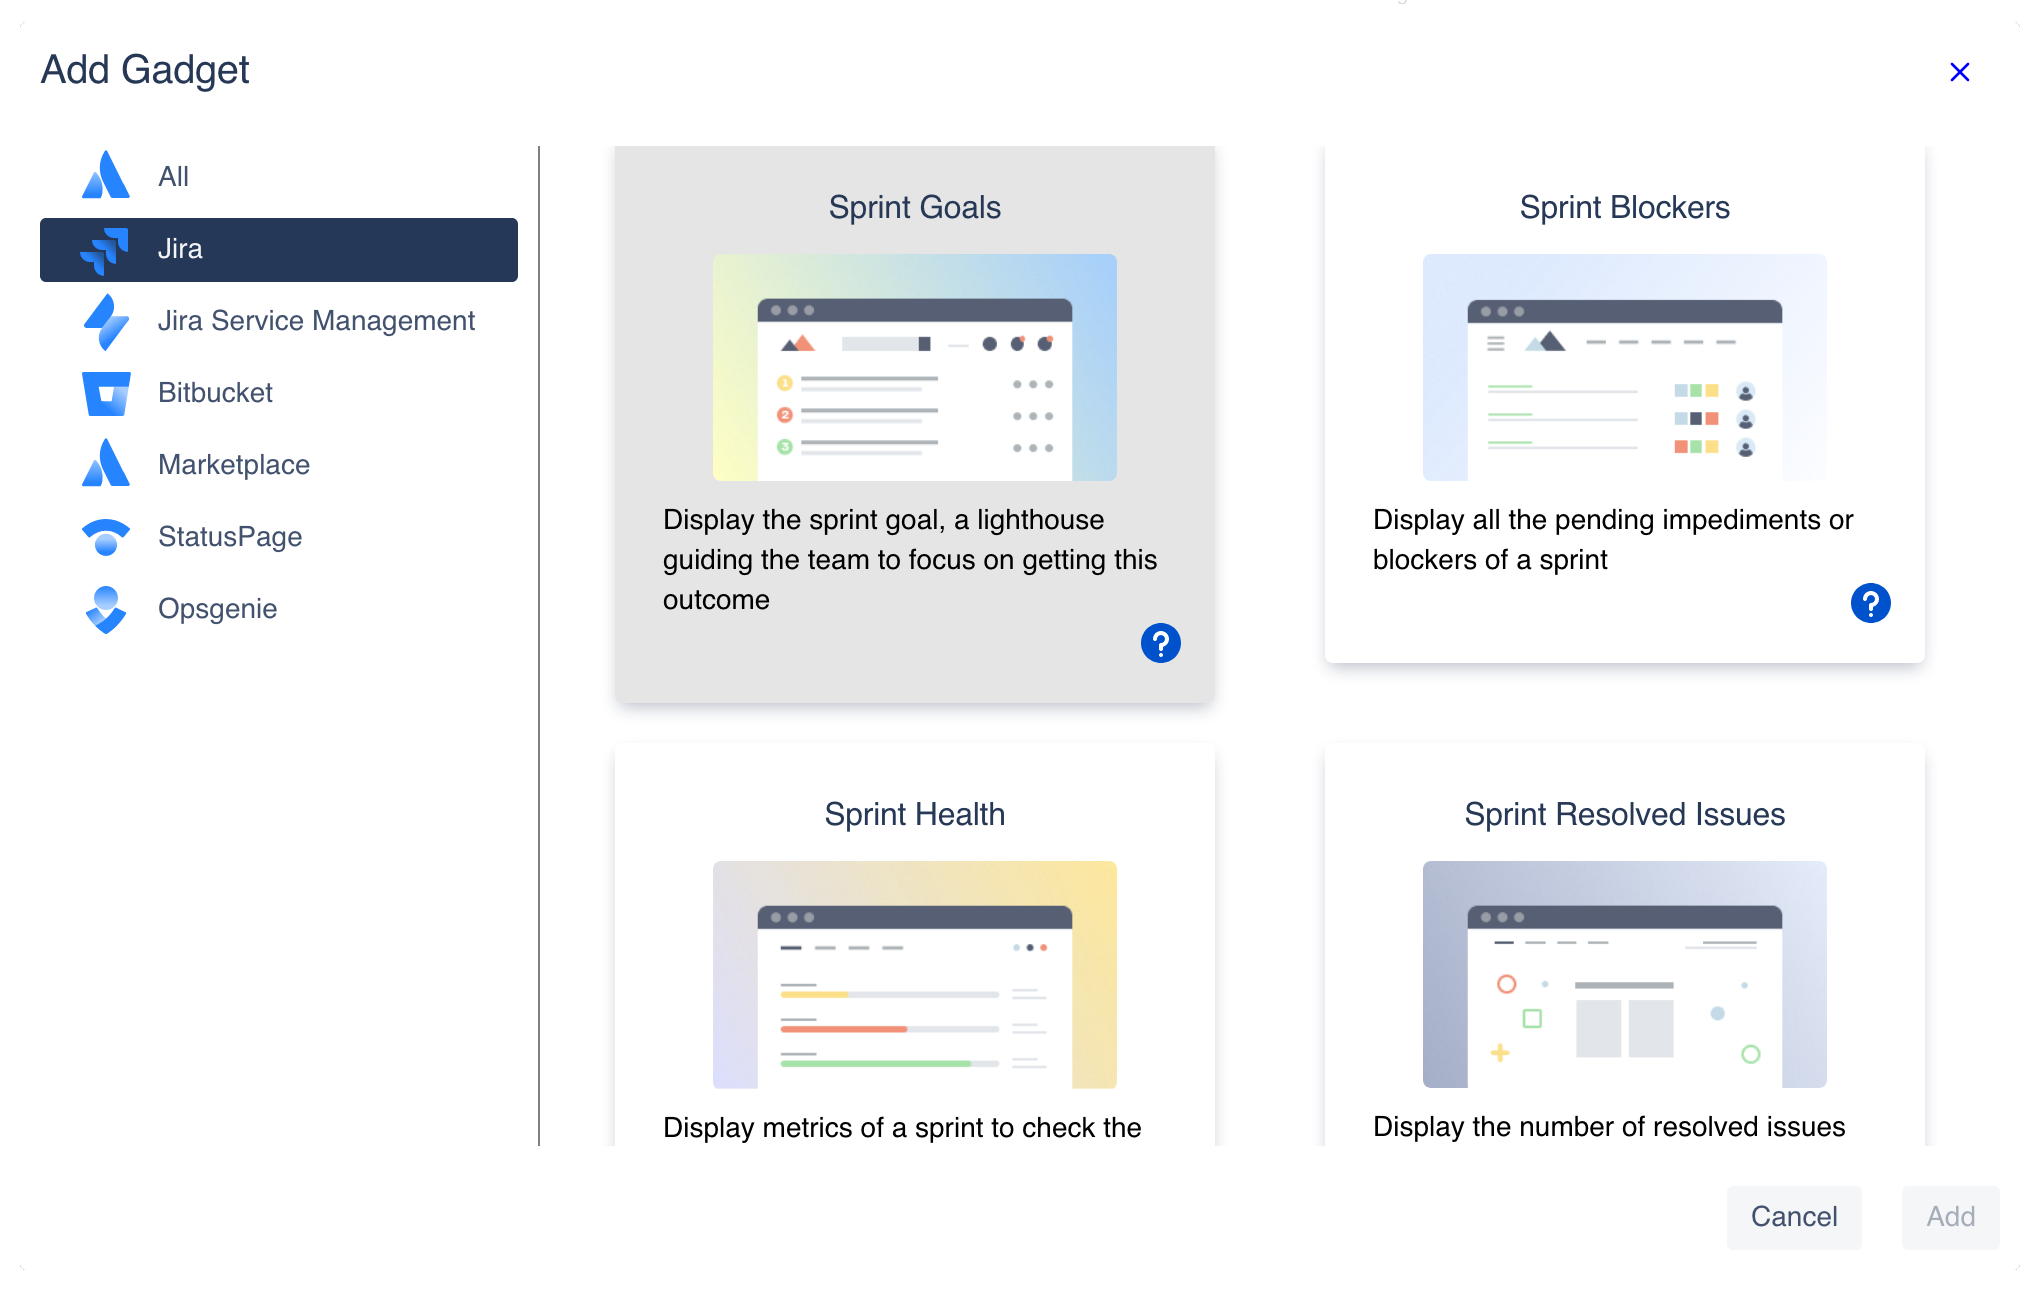
Click on the :add_plus: add gadget button to open the gadgets catalog menu (see Dashboard Gadgets: KPIs and Metrics for a complete list of available gadgets).
Access the set of gadgets available for each of the provided integrations (see Dashboard Integrations: Supported Products for a complete list of available integrations), select the one you want to add to the current dashboard.
Fill the configuration settings and click Add.
Edit your dashboard
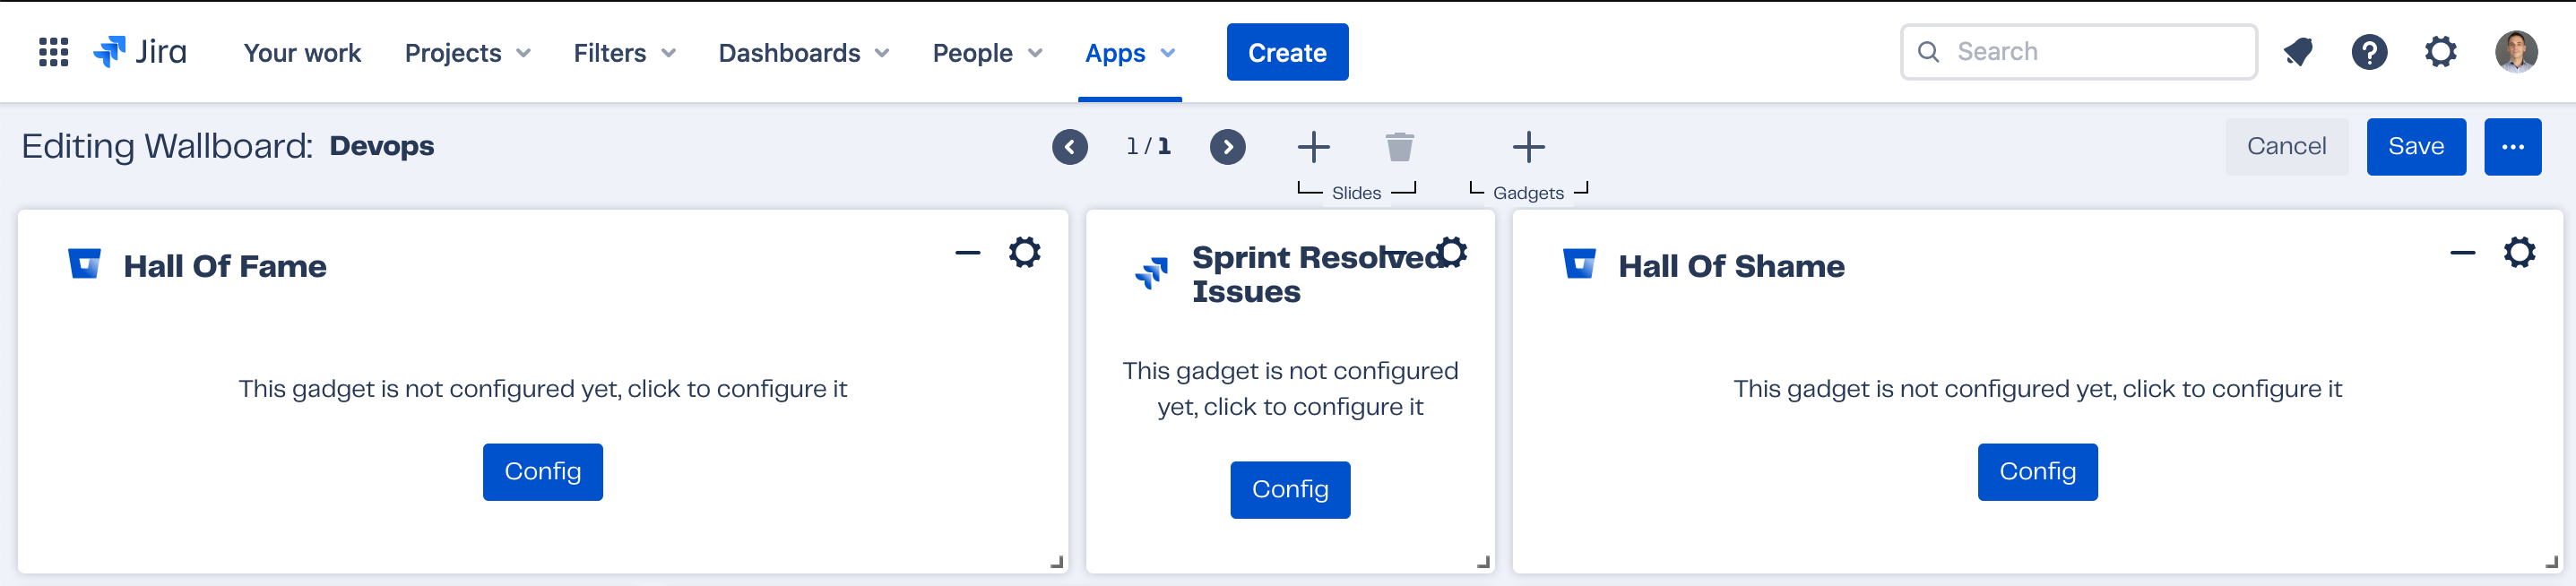
You can access the edition mode by clicking on the Edit button in the right top navigation bar, you’ll see new controls in the middle of the top navigation bar for adding slides or gadgets.
Gadgets will also display now a Config button and a :gear_settings: icon to open the gadget configuration menu.
Clone your dashboard
Whenever you need to create a similar dashboard, you don’t need to start from scratch, you can clone an existing dashboard. From the top right … menu (or from the Manage dashboards screen) click on Clone dashboard. You only need to provide a new name, a description and set the new Access restriction. We’ll take care of the rest for you, slides, gadgets or public links are copied from the original dashboard.
Delete your dashboard
Well, not much to add here, this option deletes your dashboard, completely. From the top right … action menu (or from the Manage dashboards screen) click on Delete dashboard and confirm it.
Export your dashboard
There are several use cases that require a fixed snapshot of a dashboard, either because you need to create a report in a given date and live information should be frozen in time, or because you need an image to use it in a different product or service, embed it in a Notion page (remember that we have a Confluence version too 🙂 ) or because you want a nice background for your phone.
No matter the reason, to export the whole dashboard to a png, select the option Export dashboard in the top right … action menu and voila! Your dashboard is now a snapshot in the form of an image.
Remember that you can also export individual gadgets to images, see Export Gadgets to CSV, XLSX and PNG.
Slideshow mode
See Manage Dashboards and Set Up a Slideshow.
Dark mode
To enable the Dark mode toggle the switch in the top navigation bar. By default, the wallboard mode has it enabled. The reason behind is to facilitate and increase the attention in offices, hallways or big rooms.
Thanks to the use of a darker color pallette, it reduces the emmitted screen luminance, what reduces the impact on the eyesight. It also is soothing to the eyes, and improves the visual ergonomics due to the better contrast ratios.
Share your dashboard
Did you know that you can share your dashboards with external customers, even without having access to your Jira instance? And in a secure way, thanks to our public link sharing mechanism!
The wallboard mode is the default mode when you share publicly a dashboard. To create a public link:
Click on the :shortcut_share: Share button.
Enable the Public Link toggle and copy the URL.
Use this link to display your information radiator. Remember that anyone with that link can see the dashboard content.
Wallboard mode
This is the mode that users see when accessing to a dashboard using a public link (see Learn about Access Restrictions to learn how to publicly share a dashboard with users outside your organization).
The main differences with the normal dashboard view are:
Dark mode is switched on by default, although you can switch it off.
There’s no top Jira menu bar, more the space for your dashboard.
There’re no options to edit the dashboard or the slide, but you can still control the slideshow to pause/play or go to the next/previous slide.
You can view the dashboard in full screen.
See Set Up a Wallboard.
See also
- Set Up a Wallboard
Set up your information radiator: A wallboard
- Create, Edit, Clone, Delete and Export your Dashboard
Easily create and edit your dashboard layout, add gadgets, set access restrictions or share it
- What is a Gadget?
Gadgets are the small components in a dashboard that visually transmit the data with graphs, tables, images, text, etc.
- What is a Dashboard?
A dashboard is a visualization tool that helps your team to track their work: Monitor environments, visualize sales, detect incidents, analyze performance, track projects and so on.
- Dashboard Data Perspectives: Dynamic Filter
Customize how you view dashboards using dynamic filtering.
- Dashboard Demos: Live Examples for ITSM, DevOps, Agile, Project Tracking
Find live examples of different dashboards to discover what you can do with Dashboard Hub
- How to level up your IT Service Management
Let users of your Customer Portal in your Jira Service Management (JSM) instance access live dashboards, and report JSM metrics with multi-project gadgets.
- How to Enhance your Data Visualization
Dashboard Hub enhances your data visualization with Pre-defined templates, 70+ ready-to-go gadgets and powerful integrations.
- How to Build your Central Data Hub
Centralize your data by turning Jira and Confluence into the Central Data Hub of your organization
- Dashboard Gadgets: KPIs and Metrics
Here, we classify gadgets by dashboards, but you can combine any of them in a single dashboard as you wish!