Confluence Macro: dashboard
Overview
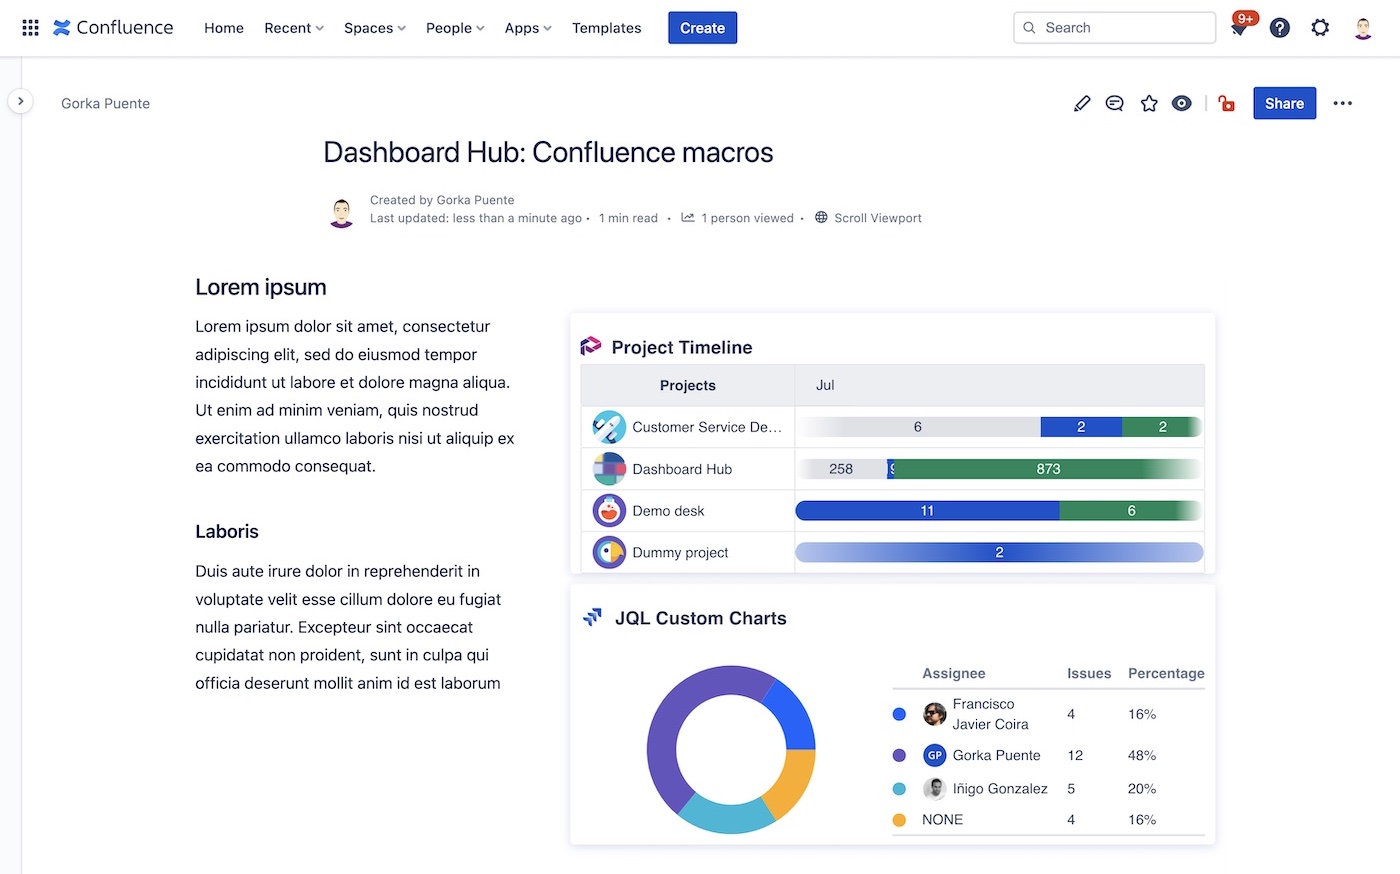
A macro for Confluence that lets you insert a whole dashboard or an individual chart in your pages, so your reports look better than ever. The Dashboard Hub dashboard macro adds reporting capabilities to your Confluence pages by:
Inserting any existing dashboard
Allowing the creation of a new dashboard
Enjoying the integration of metrics from several products: Confluence, Jira Work Management, Jira Software, Jira Service Management, Insight, Bitbucket, Opsgenie, StatusPage, Projectrak (by DEISER)…
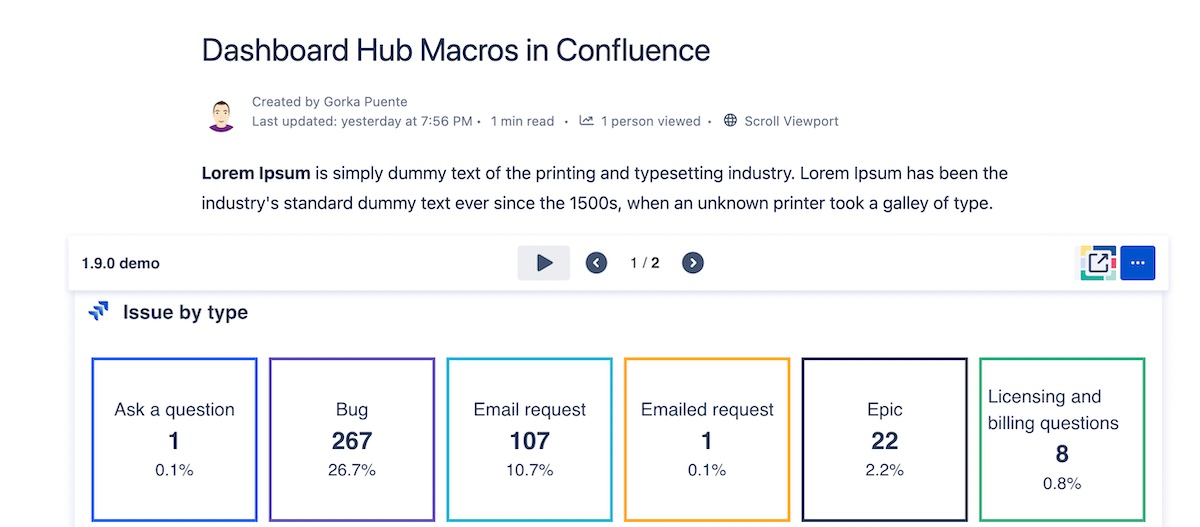
Displaying animated slideshows
Basic use
To add a macro to your page:
From the editor toolbar, choose Insert
Select the Dashboard Hub dashboard macro from the list.
Choose Insert.
Selected from the macro browser | Dashboard Hub dashboard |
|---|---|
Markup shortcut (old editor) | {dashboard-hub-macro} |
Shortcuts to bring up the same list you'd see by selecting from the toolbar:
Cloud: Type / on the page
Data Center: Type { on the page
After that, click the edit button to access the following screen:
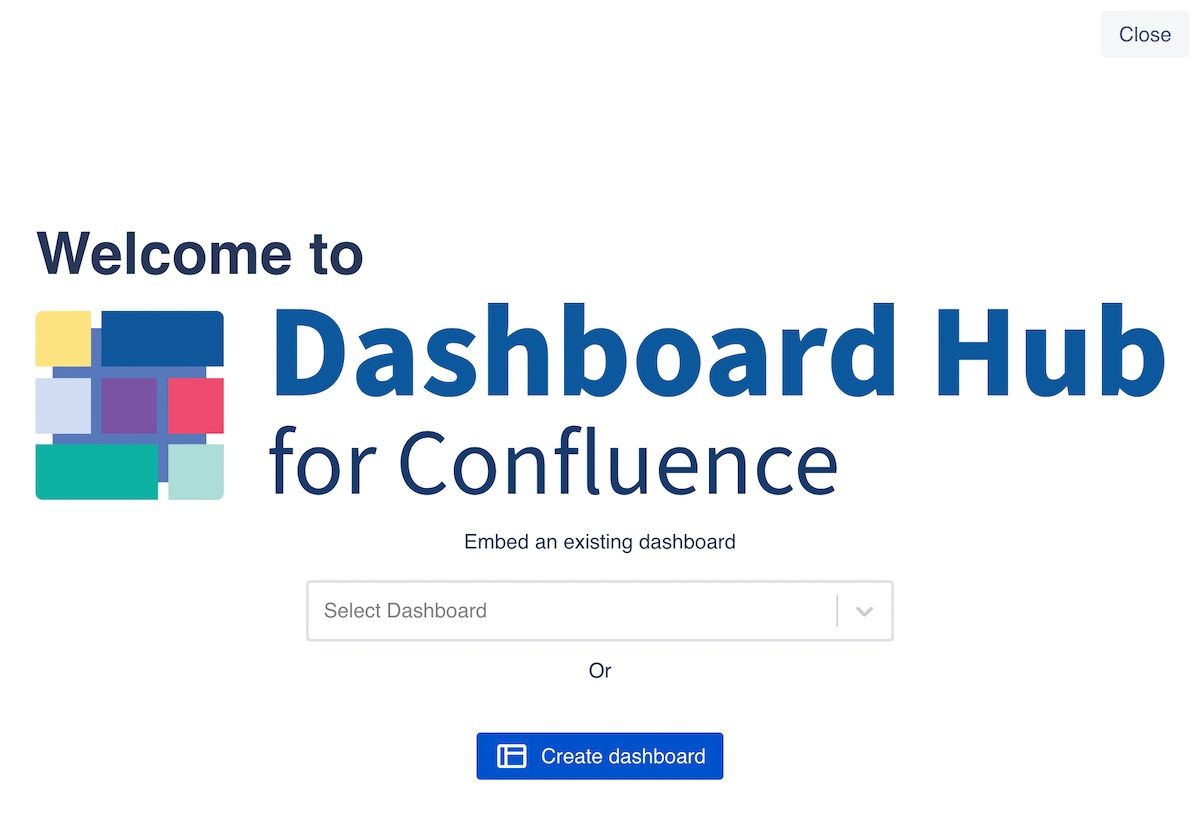
Select dashboard. Choose one of the existing dashboards in your instance.
Create dashboard. Create a dashboard either using one of the provided templates, or from scratch.
Any of the two options allow the edition of that dashboard to add or remove metrics or charts.
Slideshow
To active the slideshow mode, hover the top of the dashboard and click in the :vid_play: play button. The slides will change automatically based on the slideshow configuration of the dashboard.
The slideshow mode presents the slides of a dashboard in a sequence that changes based on the intervals set in the dashboard settings. Read Set Up a Slideshow for more info.