How to Transition from Custom Dashboards for Confluence
Learn how to migrate from Custom Dashboards for Confluence
Overview
After careful consideration, we have decided to retire Custom Dashboards for Confluence as part of our ongoing product lifecycle management process. While this app will be retired, we recommend existing customers use Dashboard Hub for Confluence for many of the same reporting features. To help make this transition easier, we’ve emailed a notice and discount code to all current customers to purchase Dashboard Hub for Confluence.
You can continue using your installed license, and we will continue supporting customers with active licenses, but we will no longer release updates through the Atlassian Marketplace. We will archive the app on November 9, 2022, and your license will no longer be renewable 90 days before this date.
We sincerely appreciate your understanding, and we hope the impact on your organization and customers will be minimal. Please don't hesitate to contact our support team if you have any questions.
Why Dashboard Hub for Confluence
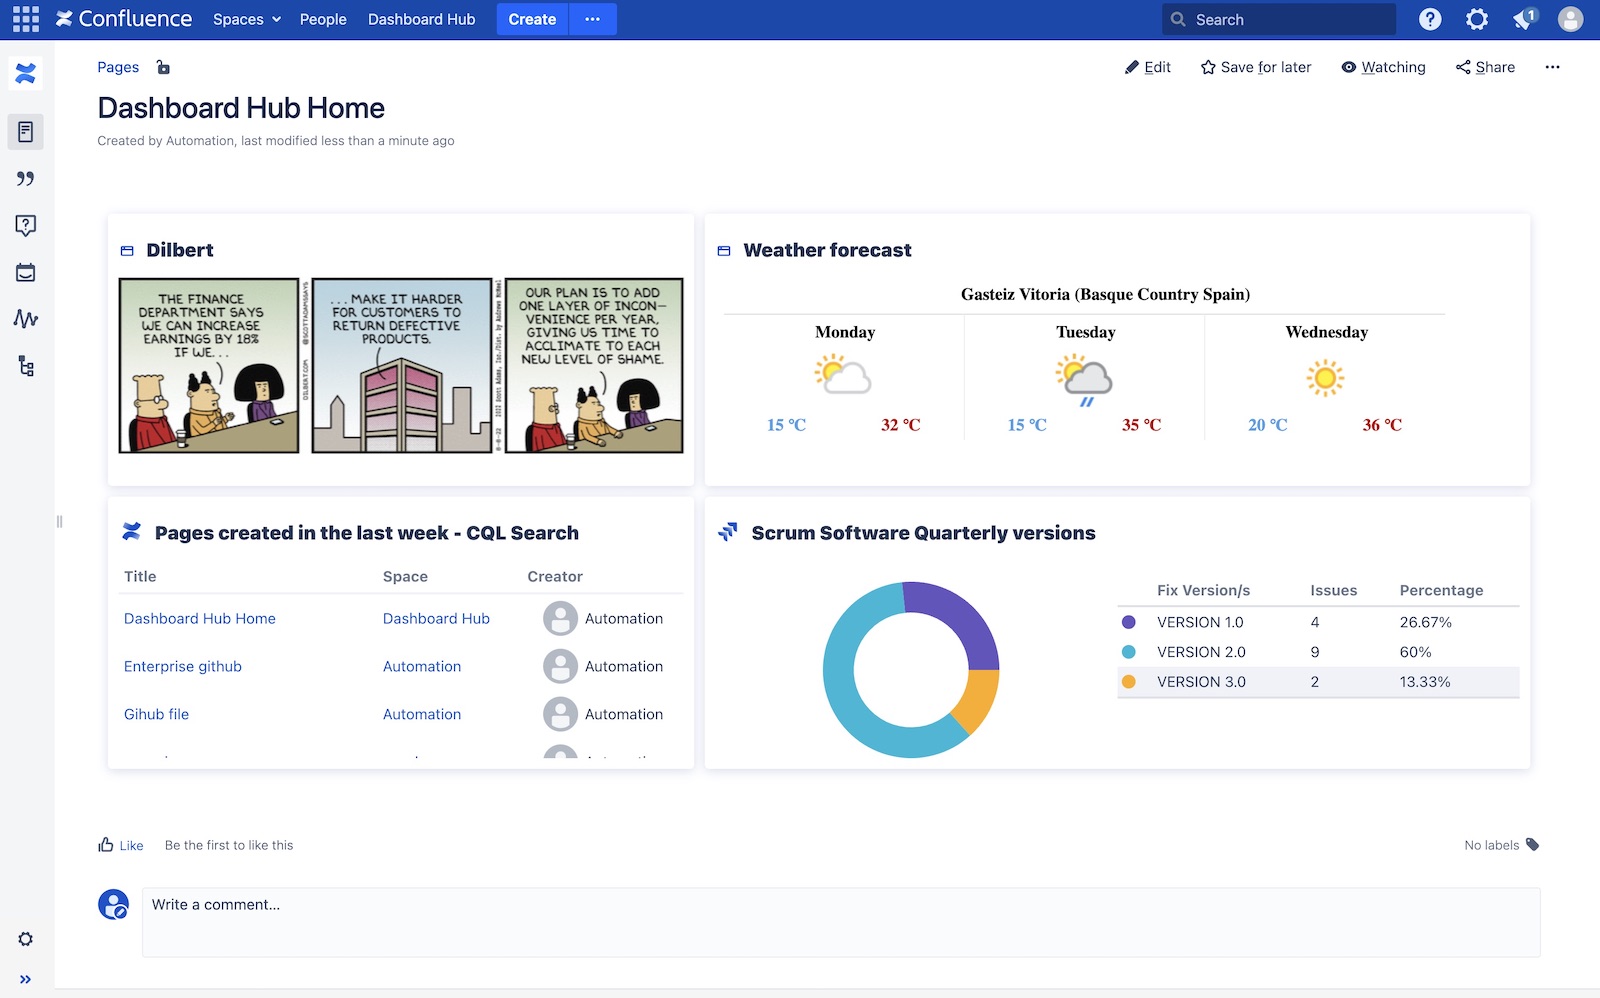
Dashboard Hub for Confluence offers a range of pre-defined dashboards templates for ITSM, Agile, or DevOps teams in Confluence. Teams can choose from 70+ gadgets, metrics, and powerful custom charts to display and visualize key data and share it on new or existing Confluence pages. Not to mention that it provides a Data Center, but also a Cloud version for those thinking of moving to the Atlassian Cloud. And for those customers coming from Custom Dashboards for Confluence, we have implemented all your favourite features, check the following table to discover the feature parity.

Feature Parity
Custom Dashboards for Confluence | Dashboard Hub for Confluence | |
|---|---|---|
Filter Rules | Replace the default global dashboard using a custom dashboard defined in a wiki page. For doing so, you create filter rules to define which dashboard needs to be displayed for which user when he clicks on a dashboard link anywhere within Confluence. View more in the app documentation. | Dashboard Hub for Confluence (in both, Data Center and Cloud) provides the ability to define rules to filter which dashboard is shown to either all users or a specific set of users and/or groups. These rules allows you to:
Read more in our documentation https://help.roninpixels.com/RDD/filter-rules-display-dashboards-by-user-or-group . |
Popular pages macro | This macro displays the most popular pages of the last 7 days as list. It displays the same content as shown on the right side of the default dashboard of Confluence. View more in the app documentation. | There’s not a specific macro for this in Dashboard Hub for Confluence, but you can use the CQL search gadget within a macro. To do this, use a CQL query like: Pages created in the last week
CODE
Pages where the current user has been mentioned
CODE
Pages watched and recently updated:
CODE
|
Dilbert macro | This macro shows a Dilbert strip on your dashboard. View more in the app documentation. | You can use the Dilbert gadget counterpart. No further configuration is needed, just add it to your dashboard or within a page using the dashboard macro. Read more in our documentation https://help.roninpixels.com/RDD/dilbert-strip . Your browser needs access to the internet to reach the Dilbert service and display the strip. |
Forecast macro | This macro displays weather information, with or without daily forecast. View more in the app documentation. | You can use the Weather gadget counterpart. Add it to your dashboard or within a page using the dashboard macro. The former weather service https://blog.darksky.net/ is no longer used due to its EOL the , so we use the Weather API from https://www.meteomatics.com/en/weather-widget/. Read more in our documentation https://help.roninpixels.com/RDD/weather-forecast . Your browser needs access to the internet to reach the weather service and display the information. |
See also
- Add and Manage Datasources
Learn how to add and configure datasources
- Set Up a Wallboard
Set up your information radiator: A wallboard
- Add and Configure Gadgets
Learn how to add and configure gadgets in dashboards
- Learn about Datasources
Learn what datasources are, what types there are and why are they one of the key assets in dashboards