Q2 2021 News
June 2021
Server version 1.3.3 for Jira and Confluence
Server is always a step behind of cloud due to the life cycle of our apps. A feature or bug fix in cloud takes way less time to be tested and released, since it has less overhead. Due to this, we have to wait a bit more to prepare a release for server.
But today is that day 🙂 we just released a ton of bug fixes (all bugs detected by customers and several detected by us) and got feature parity with the cloud counterpart.
Happy day to you 💌
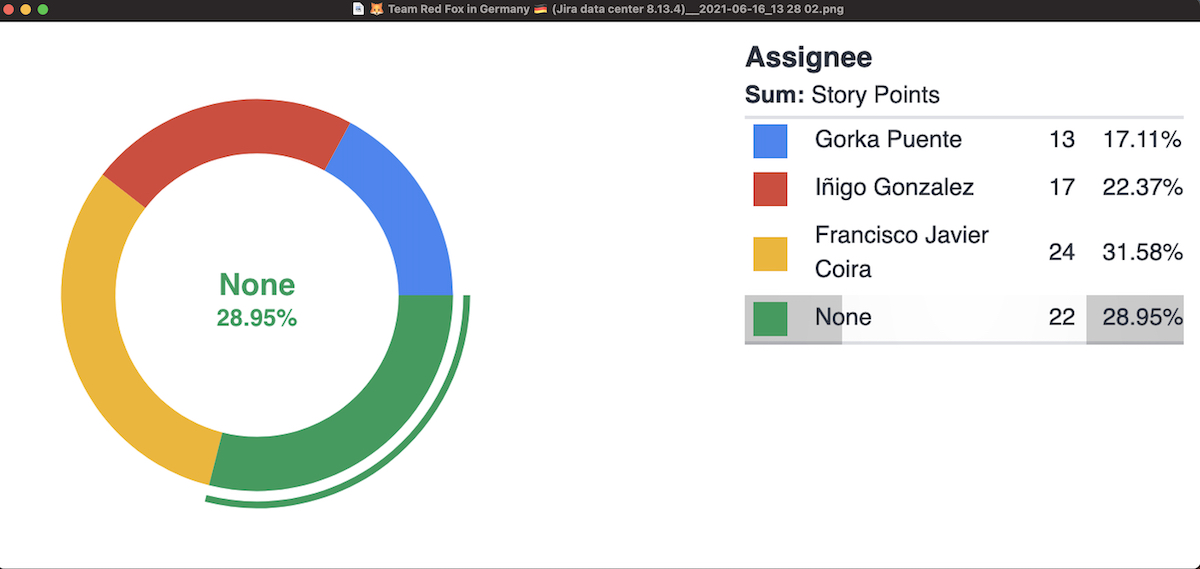
Gadget export to png
Our gadgets could already be exported to CSV or XLSX for further treatment outside Jira or Confluence (See Export Gadgets to CSV, XLSX and PNG) but we were missing the export to image format, required by our customers to freeze states of their metrics to create reports, save snapshots or use in other products or services. It’s also the previous step for the full dashboard export to image, which is… the next feature announcement!
Dashboard export to png
Exporting your metrics, gadgets or custom charts is useful, but exporting the whole dashboard to create powerful reports is AWESOME. Add your image to a Confluence or Notion page, send it by email, use it in your social media… Endless possibilities.
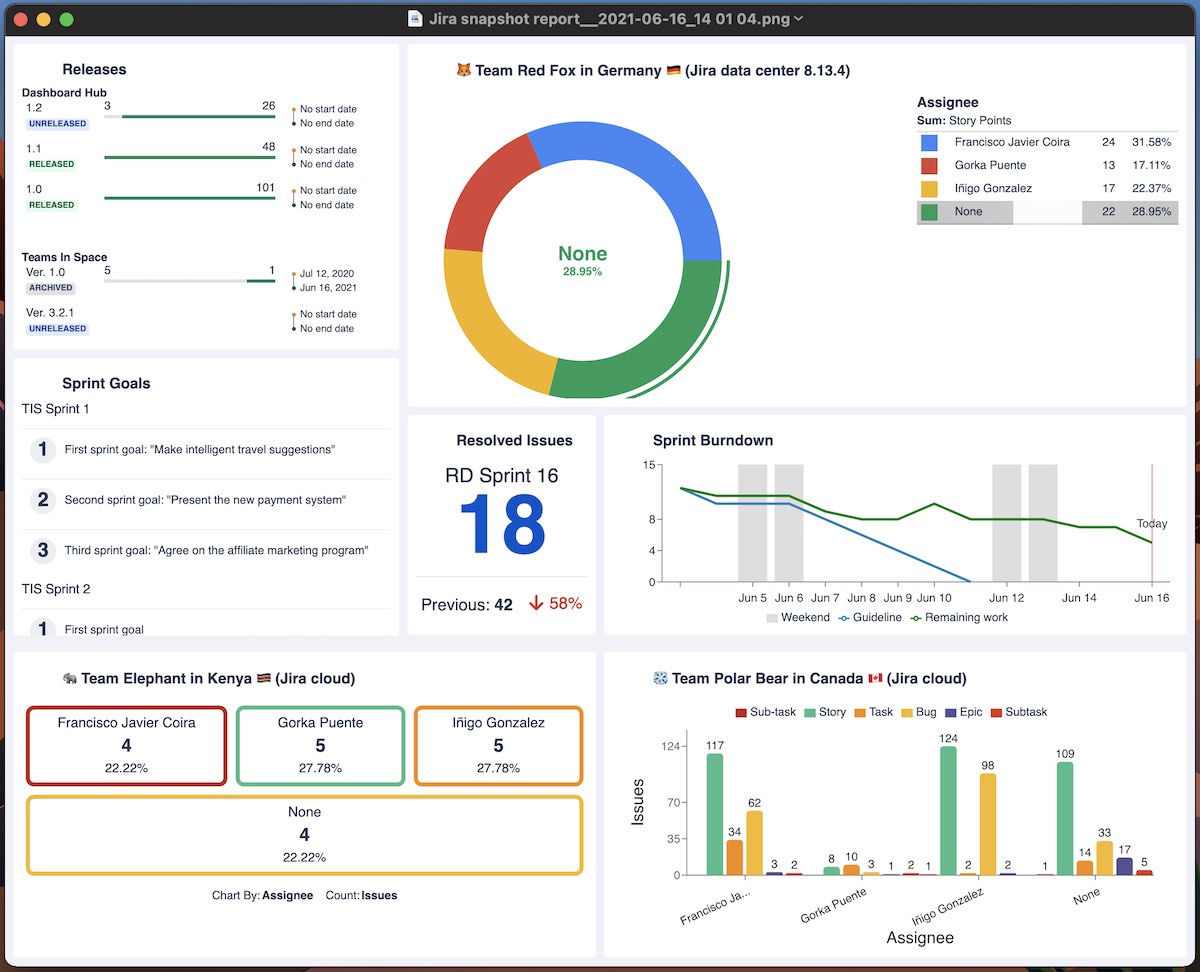
Check Create, Edit, Clone, Delete and Export your Dashboard if you need more information about handling dashboards.
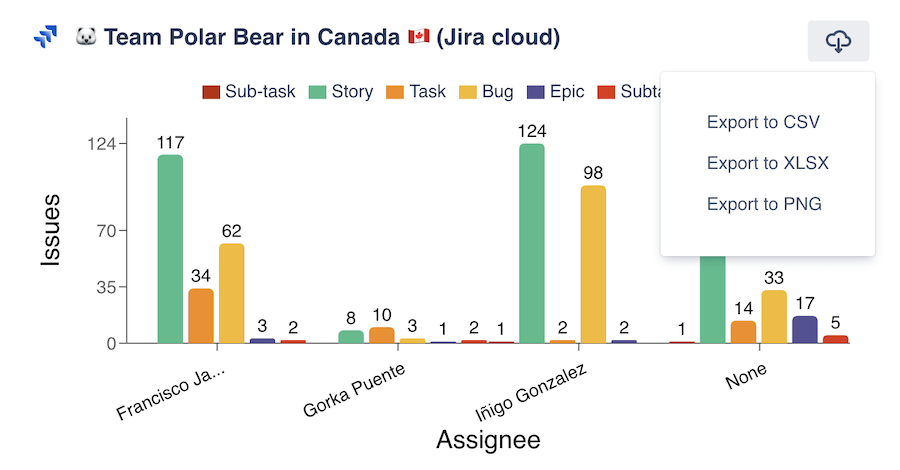
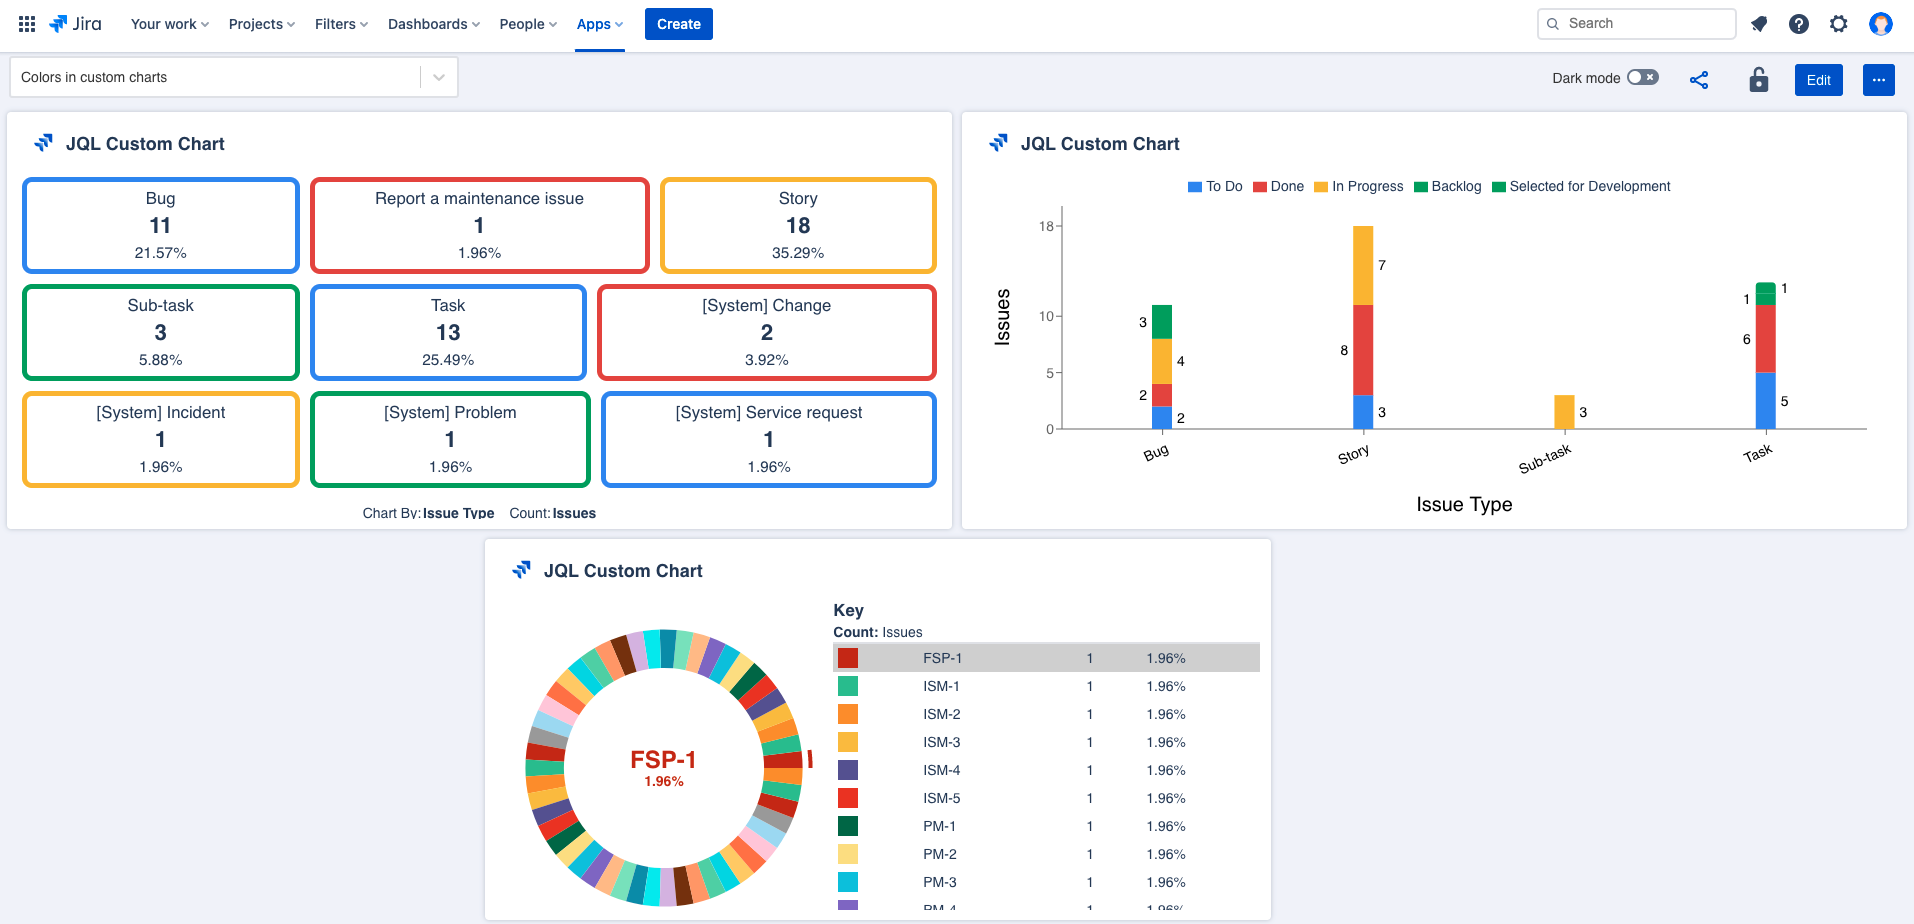
Export to CSV/XLSX in the JQL Custom Charts gadget
Not all gadgets provide the data in the same way, so we have to adapt each one of them to export their data. In this occasion, we have been working on the JQL Custom Charts gadget, which now allows exporting to CSV, XLSX and PNG. Enjoy it!
Further information in Export Gadgets to CSV, XLSX and PNG.
May 2021
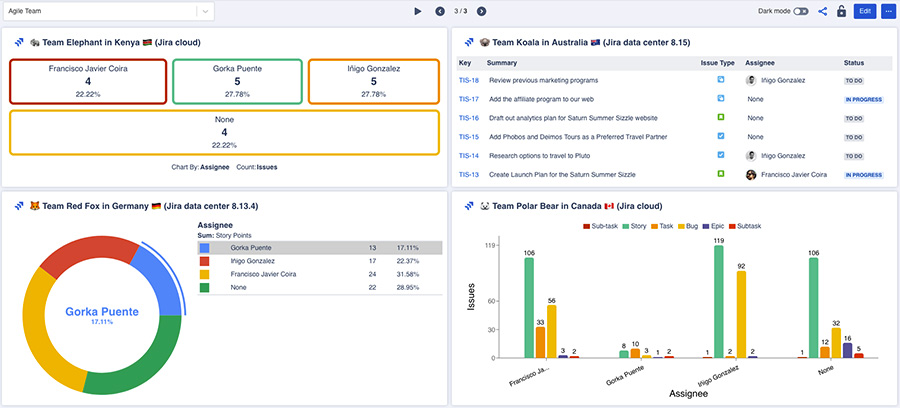
Hybrid Dashboards: Data from Server, Data Center and Cloud in the same Dashboard
Since Atlassian announced the ending of sales and support of server licenses in (read the announcement here https://www.atlassian.com/blog/announcements/journey-to-cloud), many customers started their journey to cloud. With them in mind, some solution partners suggested having a dashboard with information from server and data center instances, and that’s when the idea of Hybrid Dashboards was born: A dashboard that displays data from server, data center and/or cloud instances equally.
Read all the details here: https://help.roninpixels.com/RDD/Hybrid-Dashboards:-Data-from-Server,-Data-Center-and-Cloud-in-the-same-Dashboard.301203814.html!
JQL Custom Charts for Jira and Confluence
Our JQL Search gadget becomes JQL Custom Charts featuring awesome new features: In-product help, custom colors and the ability to hide specific segments and reorder them.
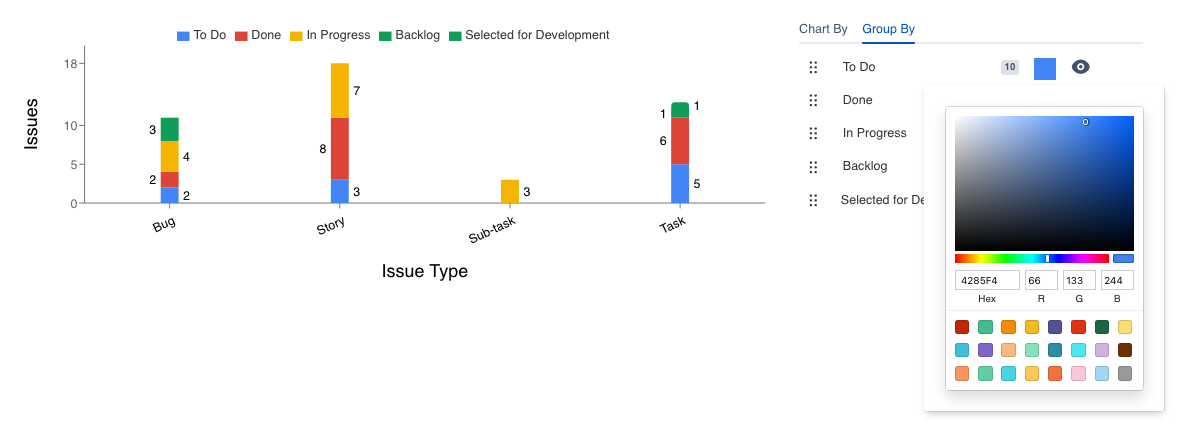
With this new feature, we cover a highly demanded need of our customers and users. Now, your reports can showcase corporate or team colors to reinforce communication, provoke emotions and highlight important information.
Read all the details in the latest article in our blog https://roninpixels.com/custom-charts/the-jql-search-gadget-becomes-jql-custom-charts-gadget/.
High Priority gadgets
Some of our customers struggle dealing with strict SLA response times of 2-3 MINUTES. Thus, the default refresh rate of 3 minutes (15 minutes for Opsgenie gadgets) was not enough. That’s why today we’re releasing High Priority gadgets!
Select up to two high priority gadgets per dashboard to see updated information every single minute and worry no more for top priority requests or failed deployments.
Read more about High Priority gadgets Manage Dashboards | High-Priority.
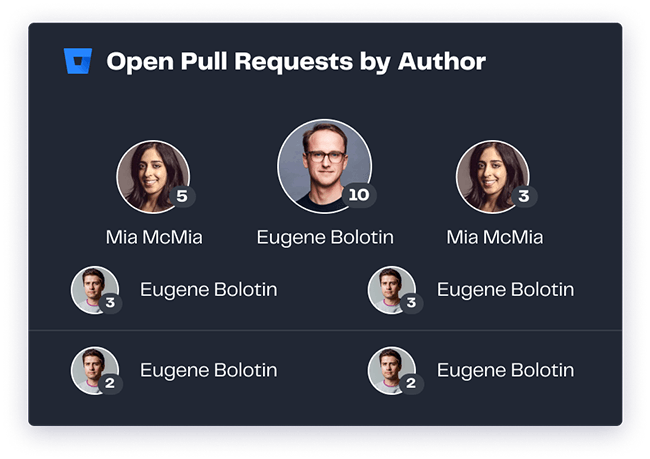
Open Pull Requests by Author gadget
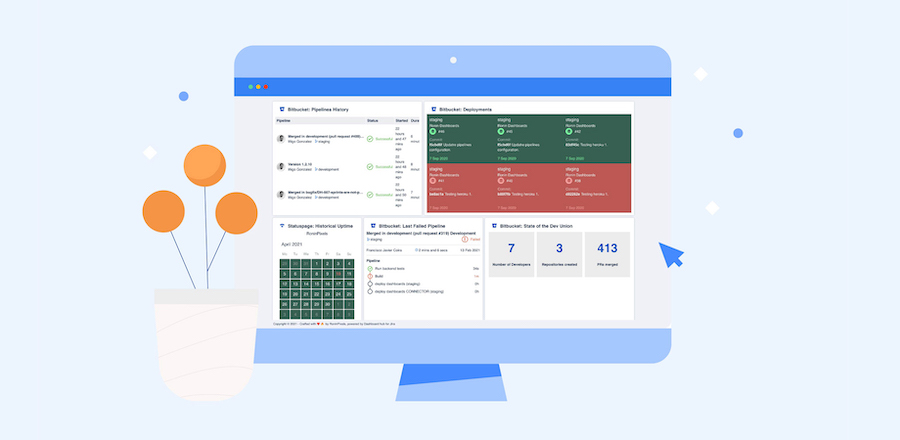
Today we also bring a new gadget for Bitbucket: Open Pull Requests by Author. This gadget displays the authors of open pull requests, in a leaderboard layout, and each avatar is clickable. When you click on one of the authors, you’ll be redirected to Bitbucket to see the summary of the open pull requests of that person.
Find out other Bitbucket gadgets here.
DH Confluence Server 1.2.10 - Initial release
And just one week after the server version of Jira was released, today we are thrilled to announced that the server version of Dashboard Hub for Confluence is available in the Atlassian Marketplace.
If this doesn’t cheer you up, go hug a cat, it works for us 😽
DH Jira Server 1.2.10 - Initial release

Today is “May the 4th be with you”, and the force is with us today because the server version of Dashboard Hub for Jira is publicly available!
We’re working on feature parity with its cloud counterpart, but soon both version will be equal.
April 2021
Password protection for externally shared links
When you activate the public link in a dashboard, the resulting URL has a with 400 characters, which together with our internal security measures (to avoid brute force attacks for example) make the link secure.
However, sometimes we use channels that are not secure enough and the link could be compromised. To avoid a situation like this, you can increase the protection by adding a password to your public link.
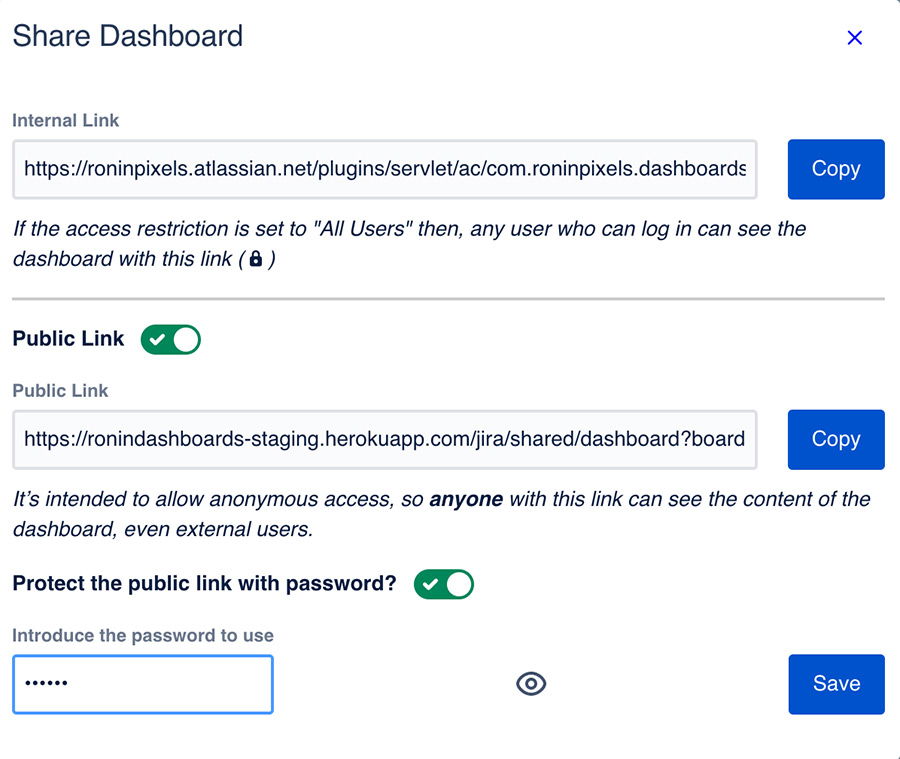
See Learn about Public or External Sharing to read about how to externally share your Confluence or Jira dashboards.
Export to CSV/XLSX data from main gadgets
We’ve had different requests for this feature: On the one hand, to let customers download the SLA information shared with them (by means of externally shared ITSM dashboards). On the other hand, to be able to download Bitbucket data as CSV/XLSX, since it’s not possible from Bitbucket itself.
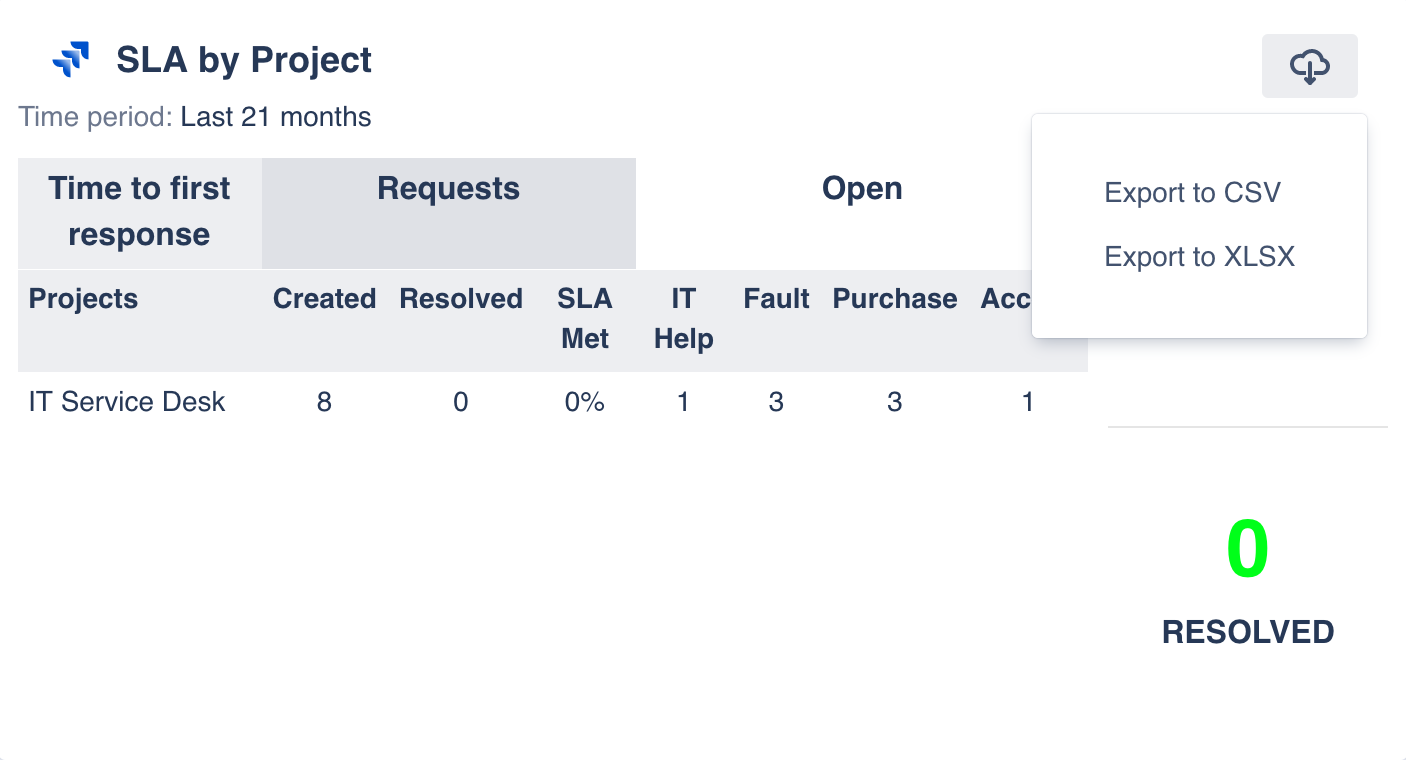
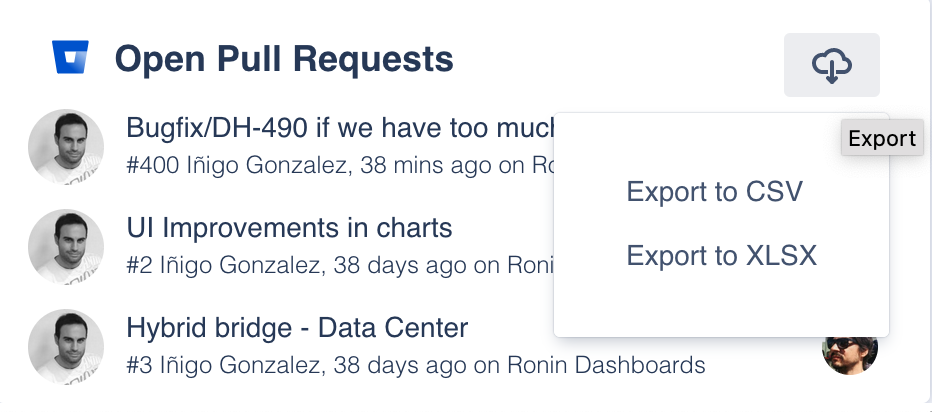
Now, when you hover a gadget a :download: download icon will appear with two options: Export to CSV and Export to XLSX.
Consult the list of gadgets that allow data exporting Export Gadgets to CSV, XLSX and PNG.
New visualization in the JQL Search gadget: Pie charts
We introduce a new way to customize your charts when creating reports our of JQL queries: Pie charts. With a new color palette and the ability to group date fields by day, week, month, quarter or year. This will make way easier to communicate your data to your team.
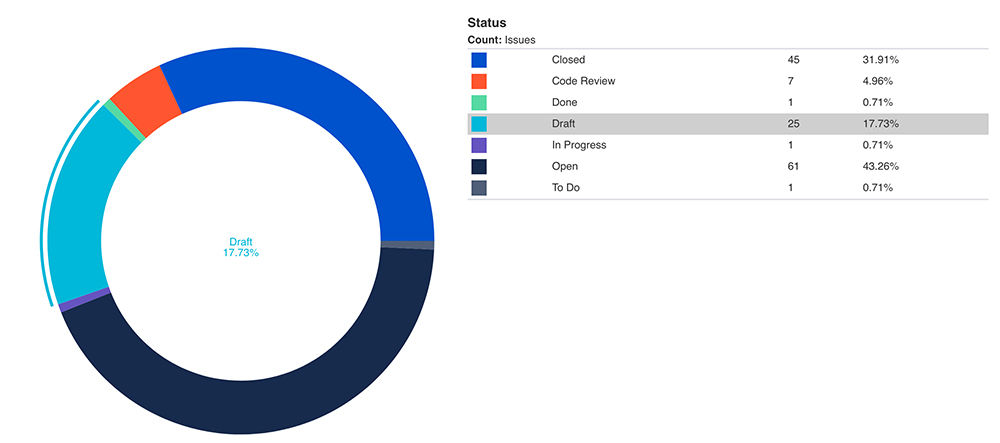
You can find more information in the JQL Custom Charts gadget documentation page.