What is a Gadget?
Overview
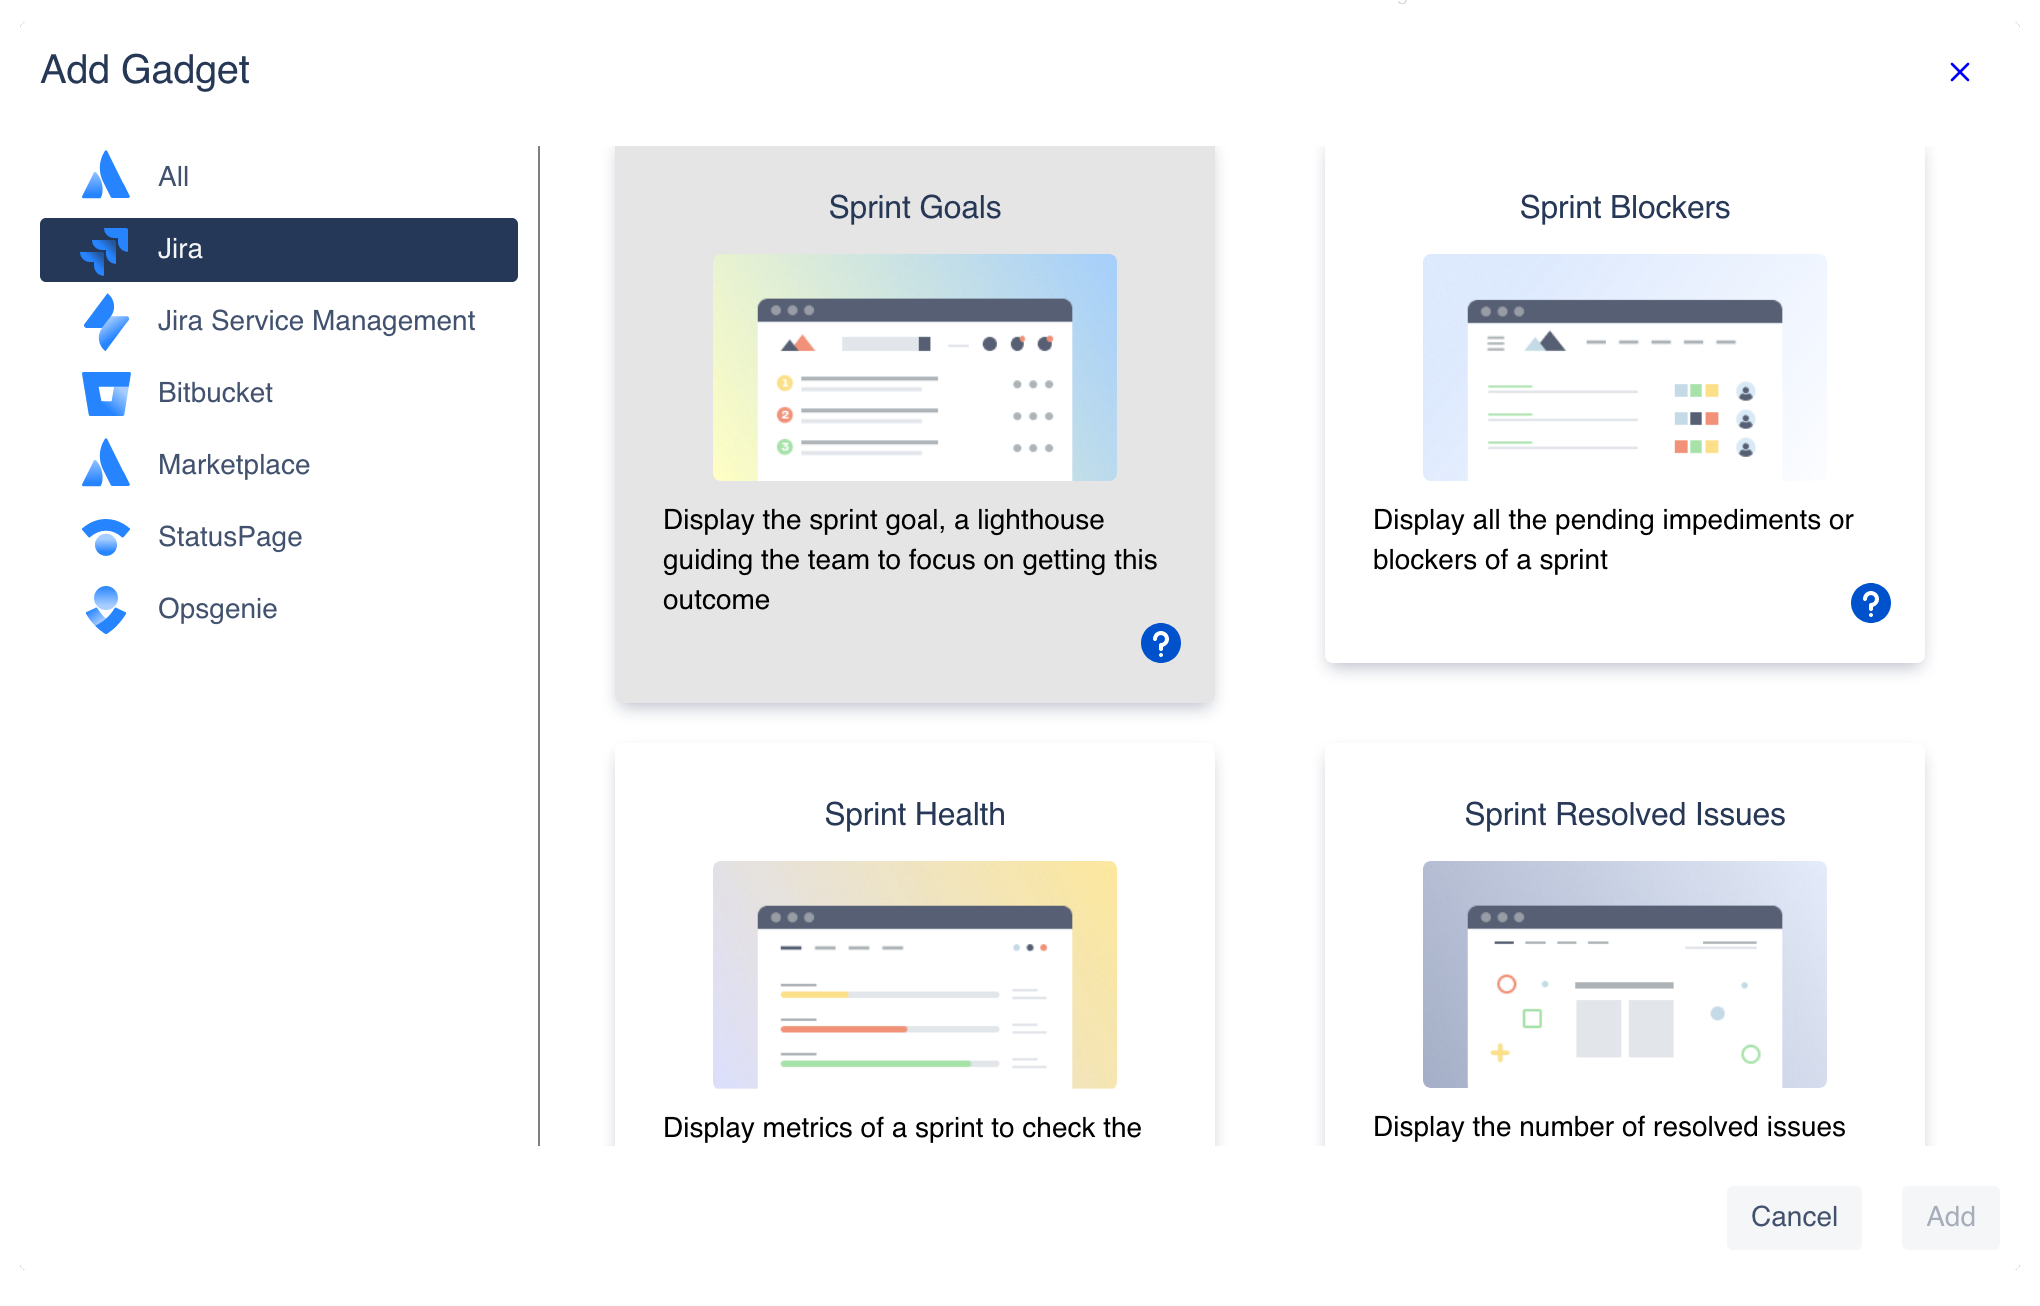
Gadgets are the small components in a dashboard that visually transmit the data. They are in charge of fetching the data from the source defined in its datasource (see Learn about Datasources), and turn it into useful information. The information is rendered in a variety of forms like plain text, different graphs, tables, images, etc.
Metrics and KPIs
Gadget are the means to track your metrics and key performance indicators (KPIs), so selecting the right ones is the first step to create useful dashboards that meet your goals. Dashboard Hub provides a growing catalog of ready to go gadgets with the main metrics and KPIs (See Dashboard Gadgets: KPIs and Metrics).
Choosing the right data visualization metaphor, in other words, how the gadget graphically represents the data, is paramount to easily transmit the information to you audience so: i) Identify your metrics, KPIs or problem to solve, ii) identify your audience, and iii) select the right gadgets for your dashboard.
See also
- Set Up a Wallboard
Set up your information radiator: A wallboard
- Create, Edit, Clone, Delete and Export your Dashboard
Easily create and edit your dashboard layout, add gadgets, set access restrictions or share it
- What is a Gadget?
Gadgets are the small components in a dashboard that visually transmit the data with graphs, tables, images, text, etc.
- What is a Dashboard?
A dashboard is a visualization tool that helps your team to track their work: Monitor environments, visualize sales, detect incidents, analyze performance, track projects and so on.
- Dashboard Data Perspectives: Dynamic Filter
Customize how you view dashboards using dynamic filtering.
- Dashboard Demos: Live Examples for ITSM, DevOps, Agile, Project Tracking
Find live examples of different dashboards to discover what you can do with Dashboard Hub
- How to level up your IT Service Management
Let users of your Customer Portal in your Jira Service Management (JSM) instance access live dashboards, and report JSM metrics with multi-project gadgets.
- How to Enhance your Data Visualization
Dashboard Hub enhances your data visualization with Pre-defined templates, 70+ ready-to-go gadgets and powerful integrations.
- How to Build your Central Data Hub
Centralize your data by turning Jira and Confluence into the Central Data Hub of your organization
- Dashboard Gadgets: KPIs and Metrics
Here, we classify gadgets by dashboards, but you can combine any of them in a single dashboard as you wish!