App Cloud Cancellations
Overview
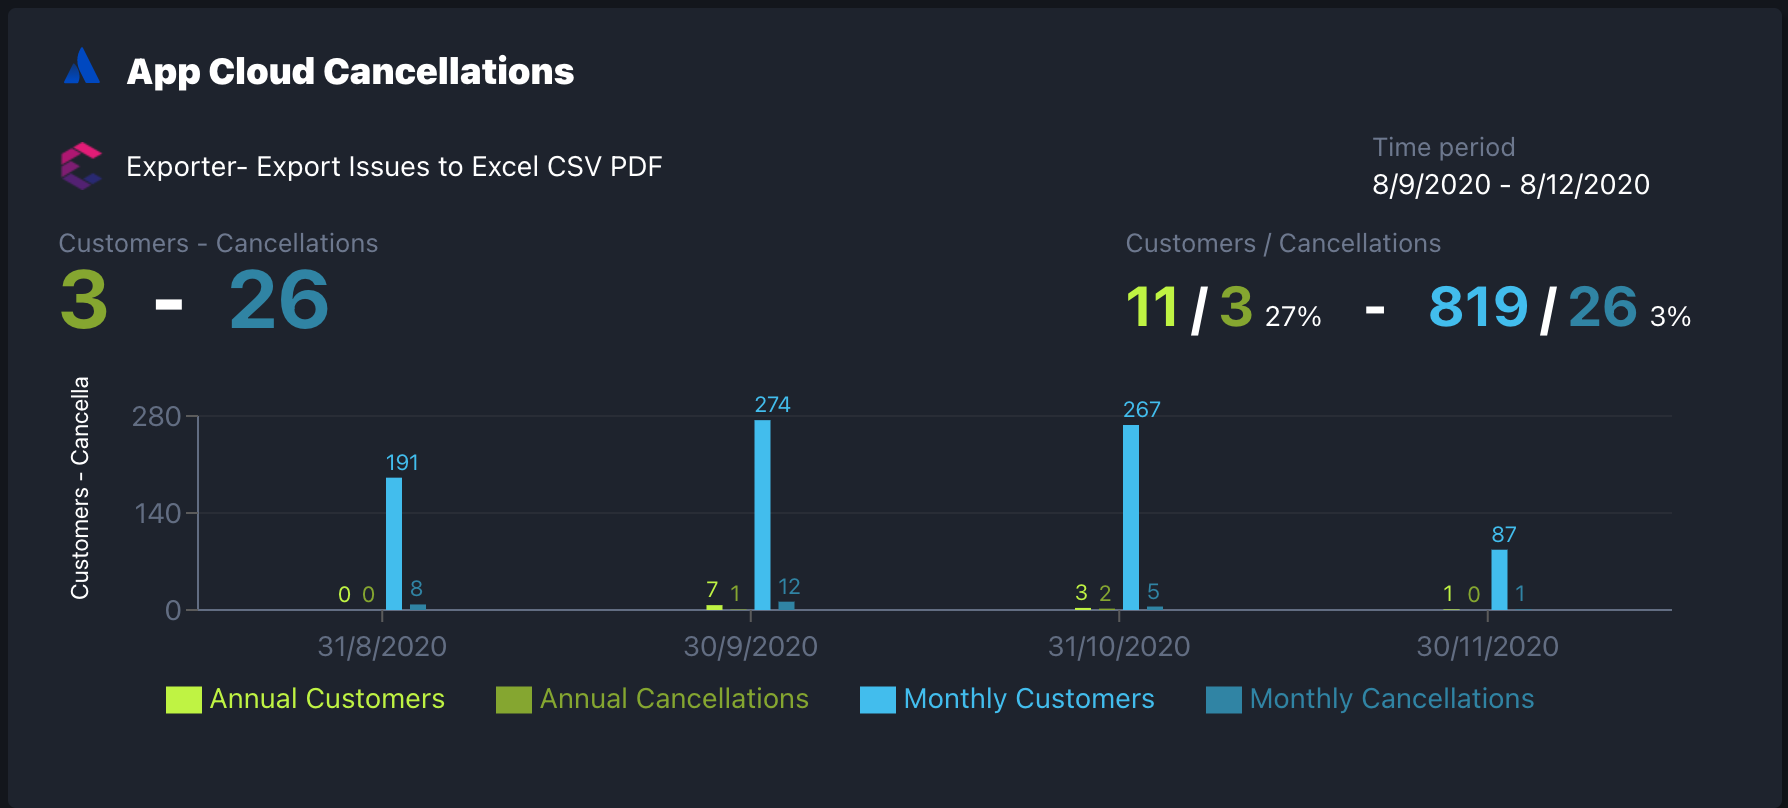
This gadget displays the number of customers and actual cancellations of cloud licenses for a specific app over a period of time. The data is grouped by week or month, and there are two types: annual subscriptions and monthly subscriptions (depends on the license).
This metric is a measure of retention, one of the keys when analyzing your sales funnel. Understanding the cancellation characteristics is critical to optimize your business, so keep it in a visible spot in your dashboard.
Cancellation rate = (# of cancelled licenses) / (# of customers) in the specified date range.
Configuration
Name your gadget meaningfully, so everyone knows at a glance what it is about and when to use it. Fill out the rest of the fields as applicable, namely:
The datasource, select a Marketplace datasource (see Add and Manage Datasources).
The vendor associated with the marketplace partner account.
The app you want the cancelled licenses data from.
The time period you want to display and compare license cancellations.
The aggregation time to group the data, either by week or month.
Finally, indicate if you want to use the current settings for all the compatible gadgets in the dashboard. This option eases the pain of configuring one by one the rest of the gadgets with the same default configuration.
Integrations
:atlassian_marketplace: (see Atlassian Marketplace)
We are working on our growing catalog of Dashboard Gadgets: KPIs and Metrics and Dashboard Integrations: Supported Products, but contact us you want us to expedite a specific one, visit our Help Center.
Dashboards
This gadget appears in the following dashboard: Atlassian Marketplace Partner template (see Atlassian Marketplace Partner).
See also
- Atlassian Marketplace Partner template
- Vendor Cloud Cancellations
- Vendor Cloud Conversions
- App Cloud Conversions
- App Cloud Cancellations
- App Cloud Renewals
- Vendor Cloud Renewals
- Vendor Feedback
- App Feedback
- Evaluations by App
- App Aggregated Sales
- App Distribution Data
- Vendor Aggregated Sales
- Vendor Distribution Data
- Vendor Total Users