App Sales
Overview
One of the main key performance indicators (KPIs) to evaluate the performance of a software product and success of a company is the sales goal.
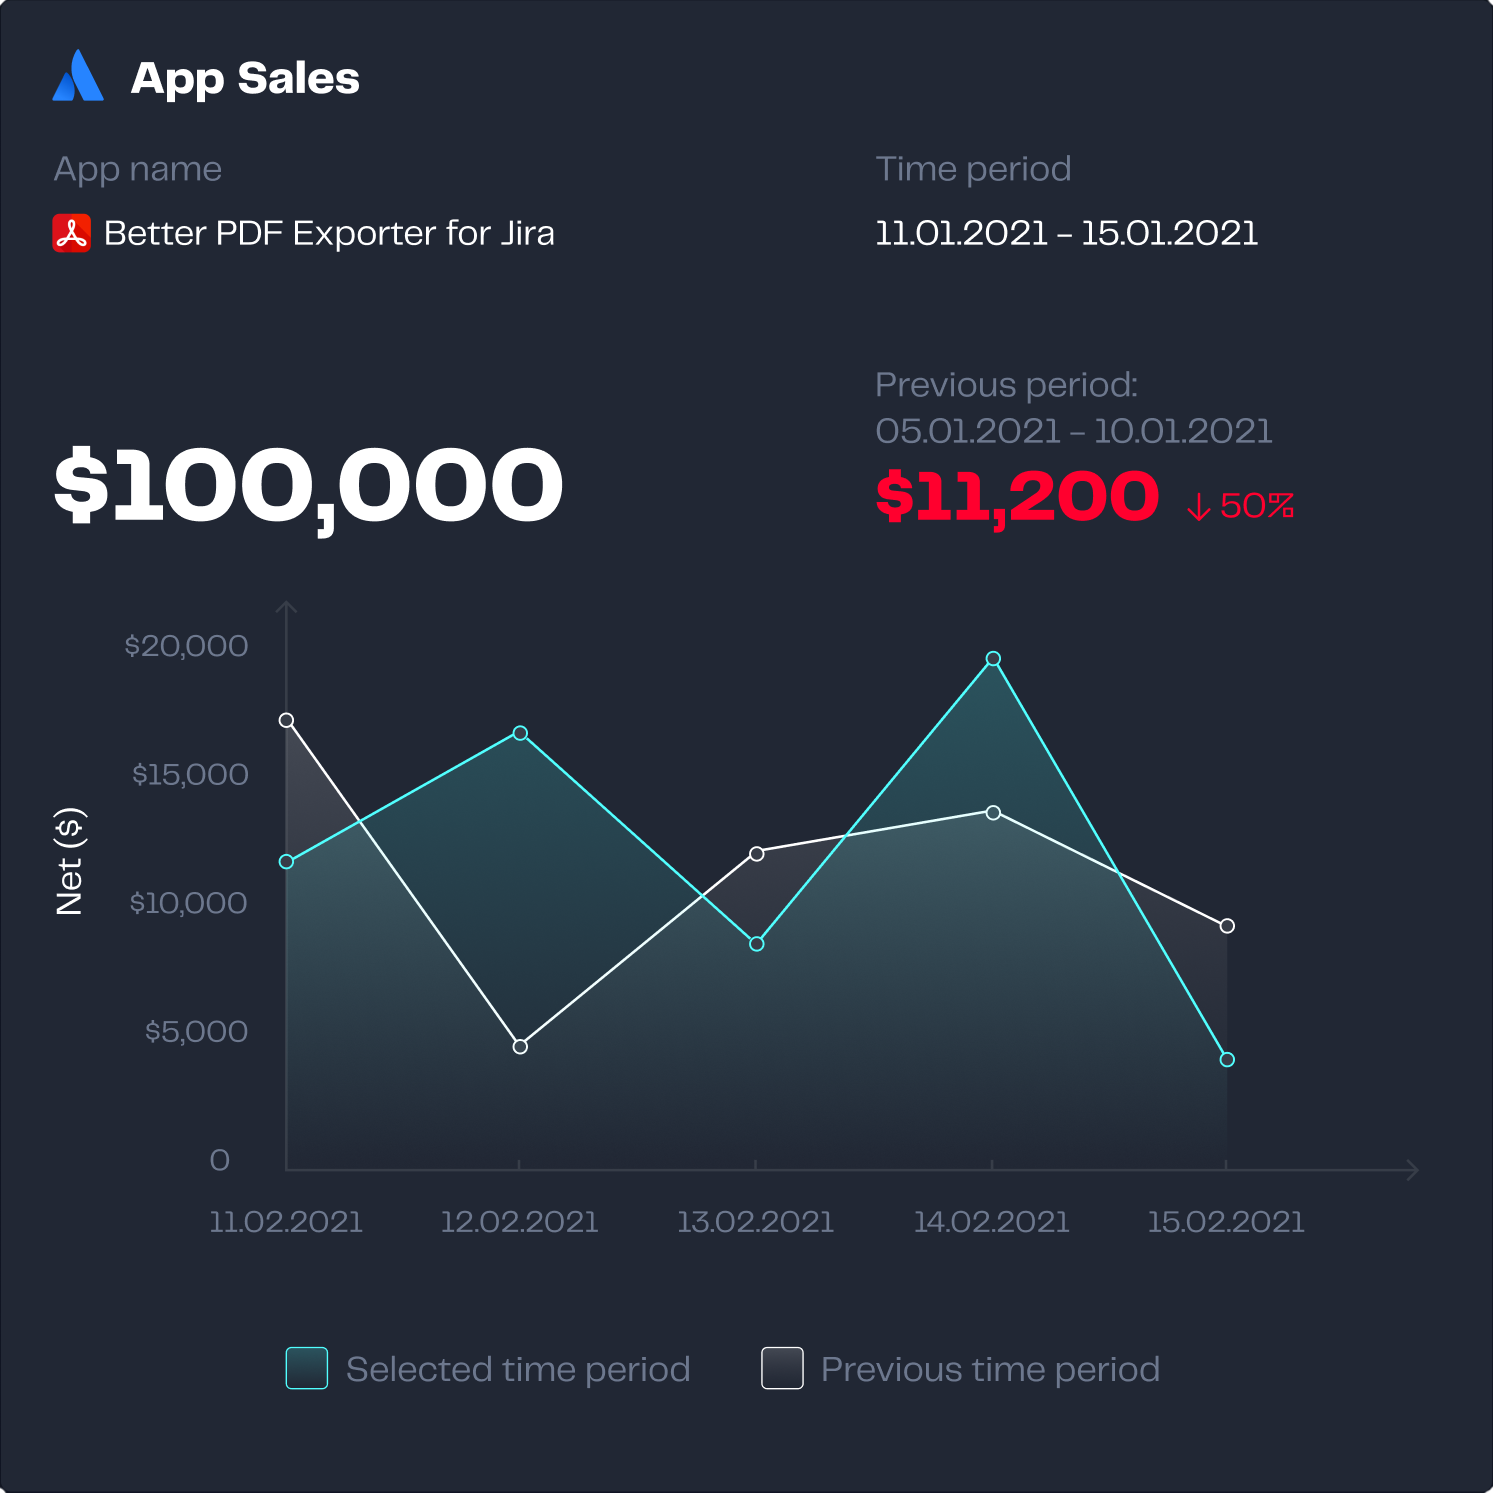
This gadget displays the sales of the selected app over a period of time. It also performs a comparison of sales with the previous period of time, to add context to the current sales. The growth over the period of time is highlighted in red, when there is a decrease in sales, and in green, when the sales are increased.
Configuration
Name your gadget meaningfully, so everyone knows at a glance what it is about and when to use it. Fill out the rest of the fields as applicable, namely:
The datasource, select a Marketplace datasource (see Add and Manage Datasources).
The vendor associated with the marketplace partner account.
The app you want the sales data from.
The time period you want to display and compare the sales of your app.
Finally, indicate if you want to use the current settings for all the compatible gadgets in the dashboard. This option eases the pain of configuring one by one the rest of the gadgets with the same default configuration.
Integrations
:atlassian_marketplace: (see Atlassian Marketplace)
We are working on our growing catalog of Dashboard Gadgets: KPIs and Metrics and Dashboard Integrations: Supported Products, but contact us you want us to expedite a specific one, visit our Help Center.
Dashboards
This gadget appears in the following dashboard: Atlassian Marketplace Partner template (see Atlassian Marketplace Partner).
See also
- Atlassian Marketplace Partner template
- Vendor Cloud Cancellations
- Vendor Cloud Conversions
- App Cloud Conversions
- App Cloud Cancellations
- App Cloud Renewals
- Vendor Cloud Renewals
- Vendor Feedback
- App Feedback
- Evaluations by App
- App Aggregated Sales
- App Distribution Data
- Vendor Aggregated Sales
- Vendor Distribution Data
- Vendor Total Users