Jira Dashboards: Native Gadgets and Product Integrations
Overview
Jira Dashboards are extensively used across organizations, so moving to a new type of reporting dashboard is a long process that requires effort and training for users. For this very same reason, Dashboard Hub for Jira offers all gadgets, metrics and product integrations natively for Jira Dashboards.
More than 70 gadgets Dashboard Gadgets: KPIs and Metrics and 10 product integrations Dashboard Integrations: Supported Products, so your teams can report effortlessly!
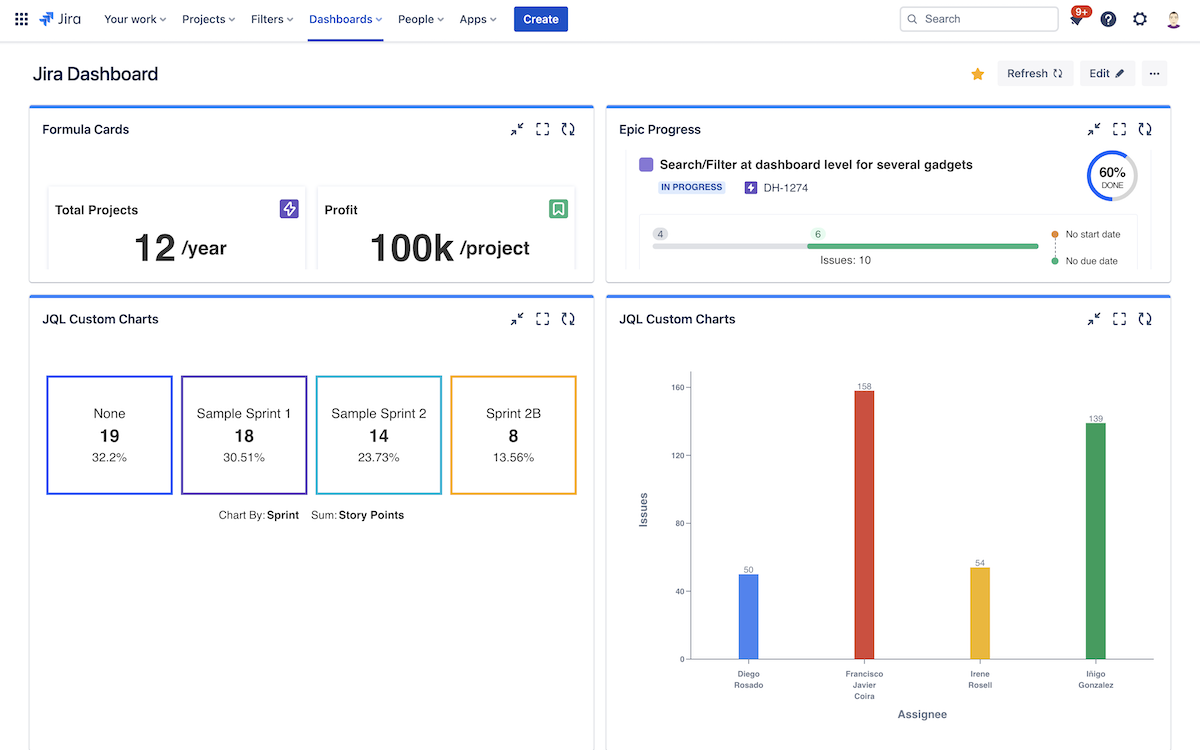
Jira dashboard with gadgets from Dashboard Hub
Remember that by using the native Jira Dashboards instead of the dashboards provided by Dashboard Hub for Jira, you won’t be able to enjoy features such as Learn about Public or External Sharing, Manage Access to the Jira Service Management Customer Portal, Manage Permissions on Dashboards , Set Up a Slideshow or dark mode among others.
Add a Gadget to a Jira Dashboard
Adding one gadget from the catalog of KPIs and Metrics from Dashboard Hub is as easy as it’s with Jira. Just follow these steps:
Go to the dashboard by selecting the Dashboards link in the top navigation bar.
On the dashboard, Click Add gadget. If you do not see this button, go to the ... menu on the top right and select Edit dashboard. The Add gadget button will now appear on your dashboard.
Use the gadget wizard to choose the gadgets you want to add.
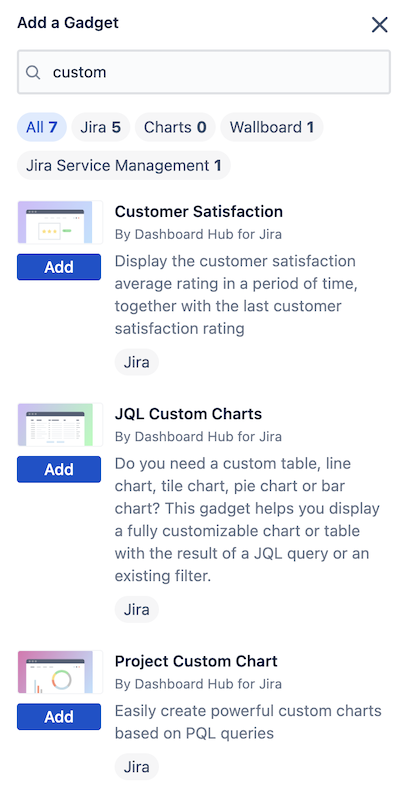
You can search for keywords to easily find gadgets
Add a Datasource to a Jira Dashboard
You can now connect to 10 different products, and not just to the current Jira instance but to any number of instances! Dashboard Integrations: Supported Products
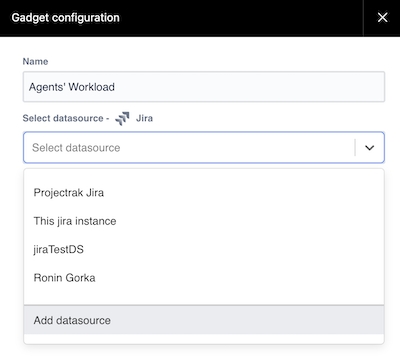
You can use any of your existing datasources; add a datasource as you normally do in Dashboard Hub (check Add and Manage Datasources for further information); or add a new one when you configure your gadget.
For doing so, click in the last option “Add datasource” in the datasource field. Next, fill the datasource configuration and ready!
See also
- Dashboard Hub Connector Apps
A connector app is a special app to integrate with external Jira instances, Confluence or Bitbucket
- Dashboard Integrations: Supported Products
Discover what products can be integrated now and what will be soon
- Add and Manage Datasources
Learn how to add and configure datasources
- Learn about Datasources
Learn what datasources are, what types there are and why are they one of the key assets in dashboards
- Jira Dashboards: Native Gadgets and Product Integrations
Enjoy all the gadgets and product integrations in your Jira Dashboards natively.
- How to Enhance your Data Visualization
Dashboard Hub enhances your data visualization with Pre-defined templates, 70+ ready-to-go gadgets and powerful integrations.
- Hybrid Dashboards: Data from Server, Data Center and Cloud in the same Dashboard
Find out everything about Hybrid Dashboards: Data from server, data center and/or cloud in the same dashboard