Scrum Velocity
Overview
Velocity in Agile teams using Scrum has been the center of many discussions. It’s due that is a key metric to forecast delivery dates and set the number of product backlog tasks to plan in upcoming sprints. Putting discussions aside, having a way to measure the work is a great help for many teams, so we created this gadget 🙂
The Scrum Velocity chart gadget shows the velocity of your Scrum team. This velocity is calculated based on the average of completed estimates from a set of sprints.
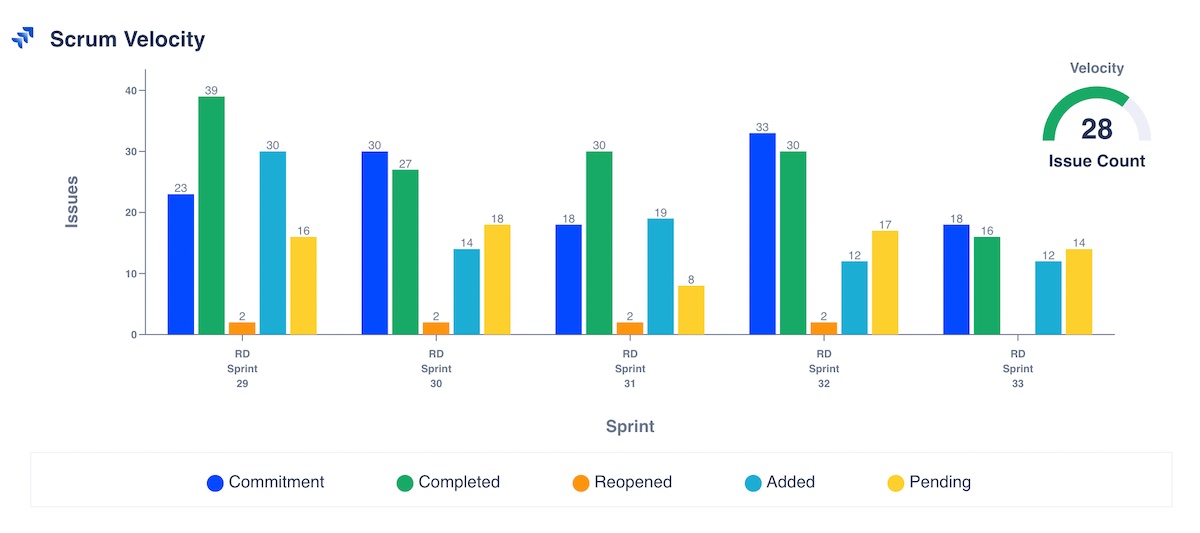
Velocity Chart for a team with a velocity of 28 issues per sprint
Sprints
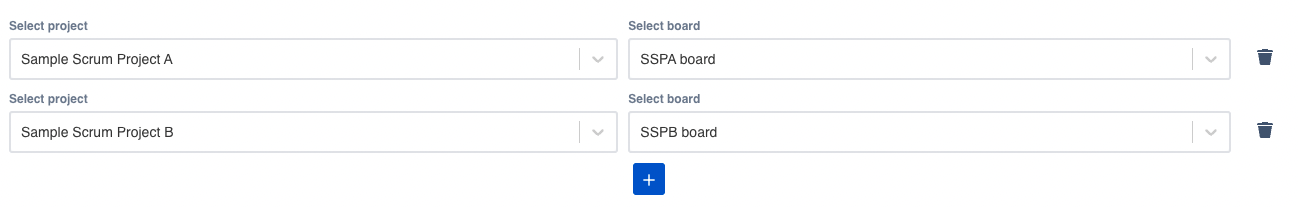
The sprints are located in either a software project or a Jira board:
And by default, the last 5 sprints are displayed, but users can select 3, 5, 10, 25, or 50 sprints among the previously selected project/boards.
Filter by sprint state
In case you want to display sprints in a specific state (active, future and/or closed), just select the state(s) to be filtered.

This gadget is multi-project / multi-board so that you can report across your whole portfolio of Scrum projects!
Estimation statistic
The y-axis displays the statistic selected to assess the velocity of your team(s). The estimation statistic can be any numeric or duration time custom field in the Jira system. However, the most common fields are:
Story points (company-managed projects, former classic projects). Your team will calculate the velocity using the story points they did in the sprint.
Story points estimate (team-managed projects, former next-gen projects). Your team will calculate the velocity using the story points estimations they did in the sprint.
Original time estimate. Your team will calculate the velocity using the time estimations they did in the sprint i.e., the duration of the issues in hours or days in the Original Estimate field.
Issue count. Your team will calculate the velocity using the number of issues completed in the sprint. And they won’t need to enter estimates!
Any numeric or duration time custom field in the Jira system.
View Type
You can select among three different visual metaphors to represent your chart: Grouped bar chart, Stacked bar chart, and Multi line chart.

Metrics to display
By default, two metrics are always displayed:
Commitment: The amount of work in the sprint when it began. The bar/line for each sprint shows the total estimate of all issues in the sprint when it begins. After the sprint has started, any stories added to the sprint, or any changes made to estimates, will not be included in this total.
Completed: The amount of work done during the sprint. The bar/line in each sprint shows the total completed estimates when the sprint ends. Any scope changes made after the sprint started are included in this total.
Optional metrics that can be selected:
Reopened: The amount of work due to issues reopened during a sprint.
Added: How much work was added to a sprint after its start (estimation of issues added to sprint).
Estimate Change: The amount of work due to changes in the estimation of story points changes.
Pending: Represents the total amount of work left in the sprint, according to your team's estimates in either story points, story points estimate, original time estimate, or issue count.

And you can change the color of each of the different metrics just by clicking in the colored circle of each metric:

Potential discrepancies
Dashboard Hub doesn’t store your data, so we cannot get historical data on the fly. If we did, your instance performance would be affected. Thus, we cannot get the removed issues from a sprint.
Velocity
Velocity is calculated by taking the average of the total completed estimates over the last several sprints. Example, the team's velocity is (17.5 + 13.5 + 38.5 + 18 + 33 + 28) / 6 = 24.75 (we've ignored the zero story point sprint). This means that the team can be expected to complete around 24.75 story points worth of work in the next sprint.

This value should become more accurate and reliable over time, as more data becomes available and the team gets better at estimating issues.
Estimates from sub-tasks are not included in the Velocity Chart's calculation. (Only estimates from parent tasks are included.)
Configuration
Name your gadget meaningfully, so everyone knows at a glance when to use it. Fill out the rest of the fields as applicable, namely:
The datasource, where Current indicates the Jira instance where the app is installed.
The project and/or board where the sprint is. It works with several sprints. Parallel sprints are not supported yet.
The Number of sprints, by default, the last 5 sprints are displayed, but users can select 3, 5, 10, 25, or 50 sprints among the previously selected project/boards.
The Sprint State(s), choose among the three different states: Active, future and/or closed.
Display sprints by time period. By default, the last sprints are displayed. However, if a time period is selected, only sprints with the end date (close date) within that time period are shown.
The estimation statistic, choose how your team estimates how much work is committed in a sprint:
Story points (company-managed projects, former classic projects). Your team will calculate the velocity using the story points they did in the sprint.
Story points estimate (team-managed projects, former next-gen projects). Your team will calculate the velocity using the story points estimations they did in the sprint.
Original time estimate. Your team will calculate the velocity using the time estimations they did in the sprint i.e., the duration of the issues in hours or days in the Original Estimate field.
Issue count. Your team will calculate the velocity using the number of issues completed in the sprint. And they won’t need to enter estimates!
Any numeric or duration time custom field in the Jira system
The View Type, select between three different charts: Grouped bar chart, Stacked bar chart, Multi line chart.
The Data visualization configuration, here you can select whether to display four optional metrics
Reopened work: The amount of work due to issues reopened during a sprint.
Added work: The amount of work added to a sprint after its start.
Estimate Change: The amount of work due to changes in the estimation of story points.
Pending work: Total amount of work left in the sprint.
Finally, indicate if you want to use the current settings for all the compatible gadgets in the dashboard. This option eases the pain of configuring one by one the rest of the gadgets with the same default configuration
Integrations
:jira_software:
We are working on our growing catalog of Dashboard Gadgets: KPIs and Metrics, but drop us a line in case you want us to expedite a specific one, visit our Help Center.
Dashboards
This gadget appears in the following dashboard: Scrum Software Team template