Epic Progress
Overview
There is an analogy used by Jeff Patton that I particularly like, and it says something like:
“Think of stories like rocks. A rock can be a boulder or pebble depending on the size (or if it’s dropped on your foot, then it’s a boulder)”
If you build software and you haven’t do it yet, we recommend the reading the book “User Story Mapping” by Jeff Patton 💯
Epics are those boulders that can be broken down into small stories. And epics are quite useful when it comes to breaking down our projects and products into pieces of work that our teams can work in. For this reason, the visualization of the progression in epics is paramount.
This gadget displays the progression in the completion of a particular group of epics by different estimation statistics.
Views
This gadget offers two different ways to represent the epics' progress: The Extended view and the List view.
Extended View
This view is thought to display a lesser number of epics but in a more clean way. The completion percentage is rendered as a donut chart with the number in percentage in the middle.
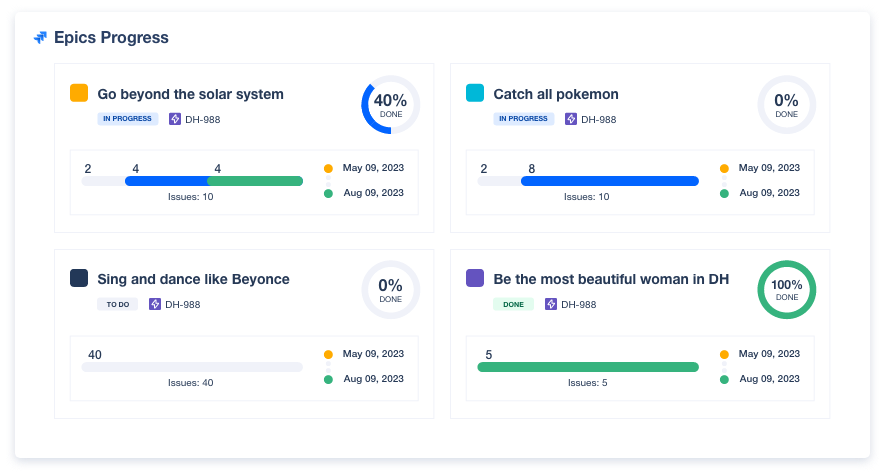
Irene, our designer, thought of the epic names
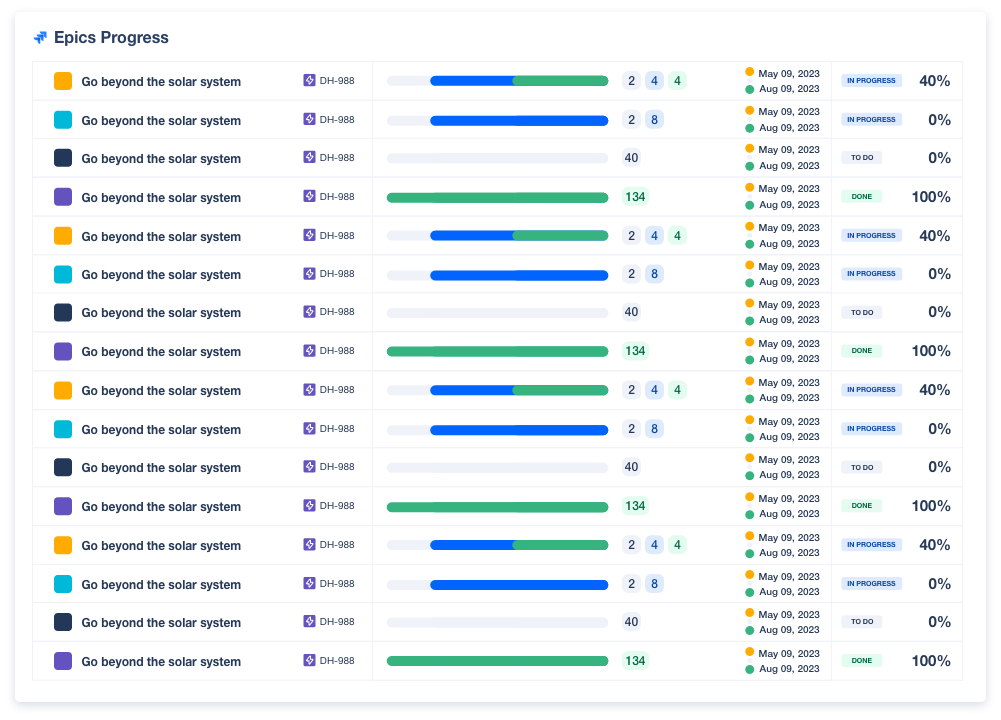
List View
This view is intended for those cases where the need to display epics goes beyond a few items. All the key information is still available but using a lean design.
Configuration
Name your gadget meaningfully so everyone knows at a glance when to use it. Fill out the rest of the fields as applicable, namely:
The datasource, where Current indicates the Jira instance where the app is installed.
The Selected Epic(s) from the result of the JQL (Jira Query Language) query or filter to filter the list of issues (see the JQL documentation). We recommend filtering as much as possible the results to optimize the performance of the dashboard. And remember that the gadget returns the results of the query, which are dynamic and can change over time.
The estimation statistic, choose how the completed work in the epic is indicated. Remember, issues without an estimation are not reflected in the calculation.
Issue count. The work done in the epic will be measured by the number of children issues completed.
Story points (company-managed projects, former classic projects). The work done in the epic will be measured by the story points estimations the team did on the children’s issues.
Story points estimate (team-managed projects, former next-gen projects). The work done in the epic will be measured by the story points estimations the team did on the children’s issues.
The View type
List View, where epics are displayed in a table-like format to maximize the number of items displayed.
Extended View, where epics are displayed in more clean and visual way.
Integrations
:jira_software:
:jira_service_management:
We are working on our growing catalog of Dashboard Gadgets: KPIs and Metrics, but drop us a line in case you want us to expedite a specific one, visit our Help Center.
Dashboards
This gadget is not included in any pre-defined dashboard; check other orphan gadgets: