Formula Cards
Overview
Unfortunately, Jira doesn’t have the capacity to perform calculations on fields. You can create custom fields to add the price per hour of your services, but you cannot calculate the total amount you have to charge for the hours billed in your project.
The Formula Cards gadget allows you to create math calculations on fields, and display the result in either an Icon Card (for numerical results) or a Donut Card a card (for percentage results).
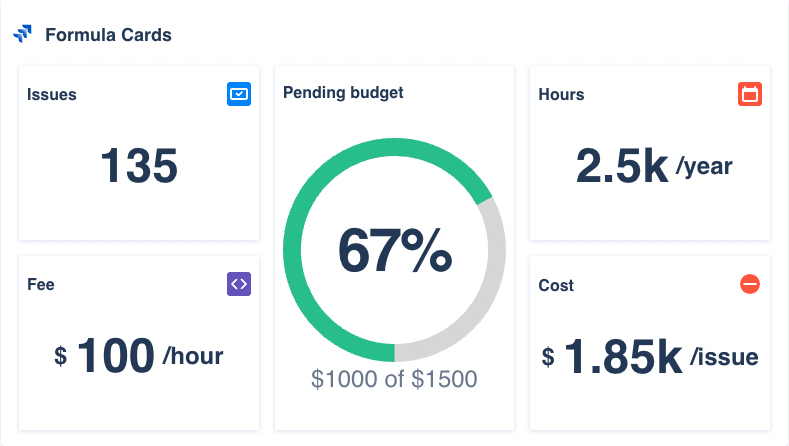
Display calculations based on your Jira fields
Create variables
Variables store values that can be referenced later in the formula. They are useful to separate data in meaningful sets, so you can refer to it easily later in the formula or as the maximum value for the Donut Card visualization in %.
You can create up to 5 variables, use existing filters or new JQL queries, and aggregate the result with different functions in your fields.

The variable a returns the total sum of 49 story points of the Scrum Project
Aggregations
Aggregations are also a common in the SQL domain. These functions get the values of grouped rows as the input of that function to return a calculated value. This gadget currently support seven functions:
Count. It counts the number of rows/elements in that group/field.
Count (distinct). It counts the number of only distinct (different) rows/elements in the group/field.
Sum. It returns the addition of the sequence of the numbers of the group/field.
Min. It returns the smallest value of the range of values of the group/field.
Max. It returns the largest value of the range of values of the group/field.
Mean. The arithmetic mean, it sums the values of the grouped rows and divides the result by how many rows are being averaged.
Median. It returns "the middle" value of the range of values of the group/field. If the number of values is even, then, the mean of the two values in the middle is returned.
Create cards
Cards display the result of a formula expression in a nice looking way. This mathematical formula accepts any of the previously created variables, but also integers and float numbers e.g., -5, 100, 23.32 or -1,000,000.2 etc.
To construct the relationship of these elements, formulas accept mathematical operators like + (plus), - (minus), * (multiplication), / (division) and ( ) (parenthesis).
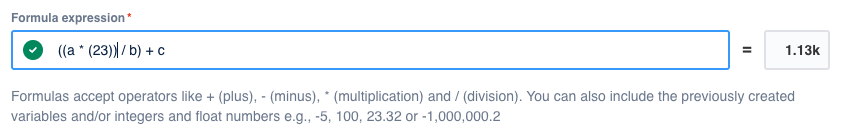
This formula multiples the value of the variable a times 23, dives the result by the variable b and sums the variable c, totalling 1.13k (1,130)
To present the result you can choose between two different views:
Icon Cards, where you can visually display any result of the formula with an icon.
Donut Cards, where you can represent percentages in a donut chart.

View type: Icon Card
The Icon Card requires:
A label (mandatory) to provide a meaningful description of the resulting number.
A prefix and/or suffix (optional) to add units or extra information to the number.
An icon (mandatory) to give a visual clue of the provided number.
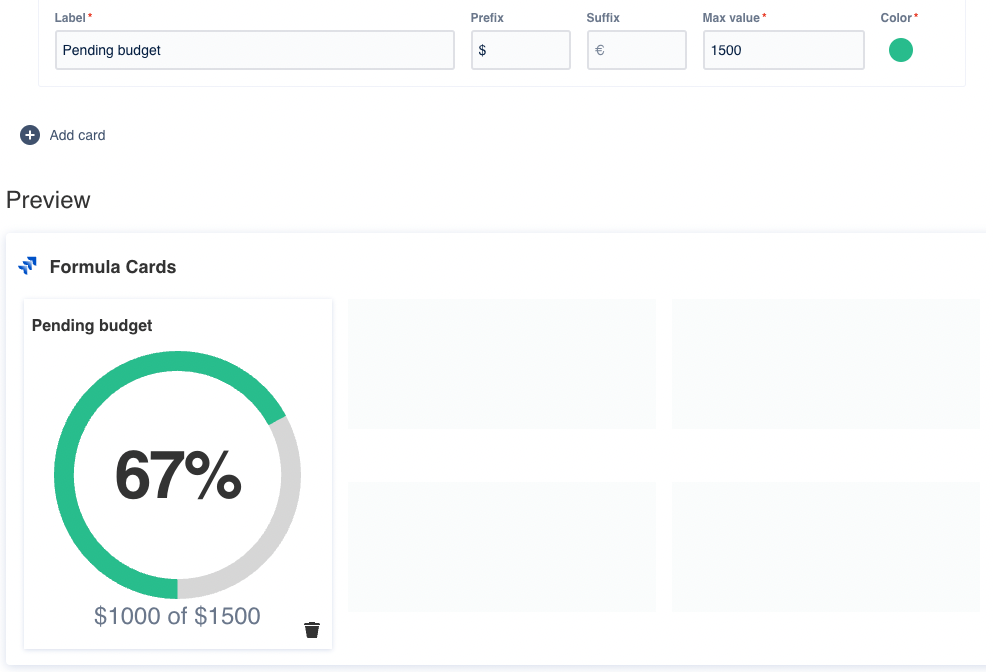
View type: Donut Card
The Donut Card requires:
A label (mandatory) to provide a meaningful description of the resulting percentage.
A prefix and/or suffix (optional) to add units or extra information to the number.
A max value (mandatory) to indicate maximum value of the percentage and paint the donut chart accordingly. If the max value is 100 and the result of the formula is 50, then, half of the donut will be painted in the selected color.
A color (mandatory) to paint the donut chart.
Configuration
Name your gadget meaningfully, so everyone knows at a glance what it is about and when to use it. Fill out the rest of the fields as applicable, namely:
The datasource, where the source Jira instance is installed.
The variables, where each one:
The JQL (Jira Query Language) query or filter to filter the list of issues (see the JQL documentation). We recommend to add at least one clause, for example to list all the issues of the project Teams in Space use the clause
project = "TIS”. And remember that the gadget returns the results of the query, which are not fixed and could change over time.The aggregations to perform calculations -Count, Count (distinct), Sum, Min, Max, Mean, Median- over the results. Check the aggregations section.
The field to select what do you want to apply the calculation to e.g., Story Points.
The cards, where each one:
The view type
Icon Cards, where you can visually display any result of the formula with an icon.
Donut Cards, where you can represent percentages in a donut chart.
The formula expression accepts the previously created variables, integers and float numbers e.g., a, b, -5, 100, 23.32 or -1,000,000.2 etc. And mathematical operators like + (plus), - (minus), * (multiplication), / (division) and ( ) (parenthesis).
Finally, indicate if you want to use the current settings for all the compatible gadgets in the dashboard. This option eases the pain of configuring one by one the rest of the gadgets with the same default configuration
Integrations
:jira_software:
:jira_service_management:
We are working on our growing catalog of Dashboard Gadgets: KPIs and Metrics and Dashboard Integrations: Supported Products, but contact us you want us to expedite a specific one, visit our Help Center.
Dashboards
This gadget is not included in any pre-defined dashboard, check other orphan gadgets: