Vendor Sales
Overview
A big picture of organizations is often represented as the product sales over a period of time, usually quarters, and the comparison with the previous period of time. This overview gives valuable information, which combined with other metrics, are used to take the pulse of the business.
During the second quarter of fiscal 2020, the Atlassian Marketplace surpassed $1 billion in lifetime sales since its inception in 2012
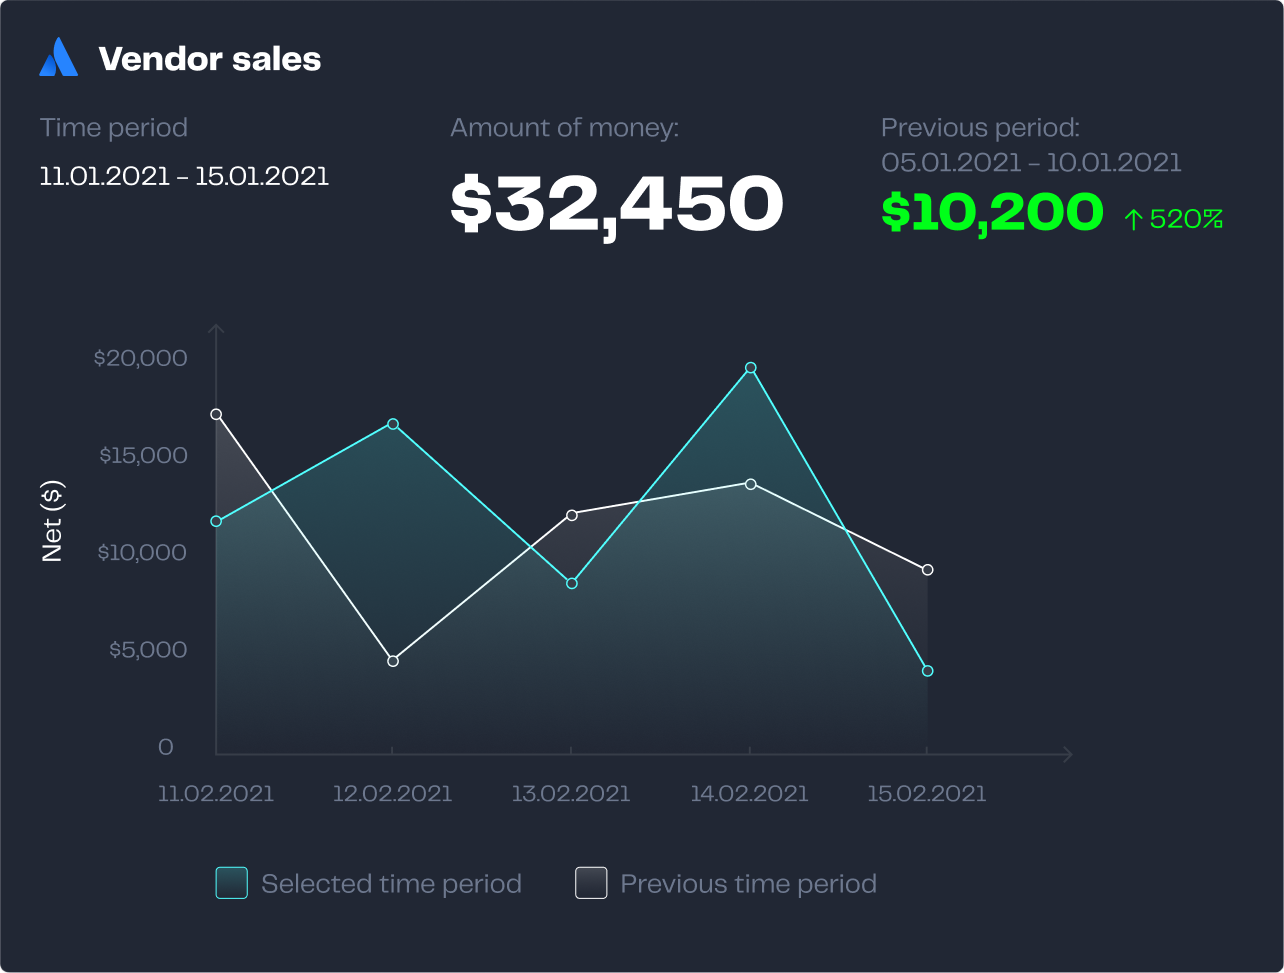
This gadget displays the total amount of sales of a marketplace partner account, no matter the apps, over a specific period of time. The sales are compared with the previous period of time in both, total amount and percentage, during that period of time. The variation is indicated in green for increments and red for decrements.
Configuration
Name your gadget meaningfully, so everyone knows at a glance what it is about and when to use it. Fill out the rest of the fields as applicable, namely:
The datasource, select a Marketplace datasource (see Add and Manage Datasources).
The period of time you want to display and compare the total sales.
The vendor associated with the marketplace partner account.
Finally, indicate if you want to use the current settings for all the compatible gadgets in the dashboard. This option eases the pain of configuring one by one the rest of the gadgets with the same default configuration
Integrations
:atlassian_marketplace: (see Atlassian Marketplace)
We are working on our growing catalog of Dashboard Gadgets: KPIs and Metrics and Dashboard Integrations: Supported Products, but contact us you want us to expedite a specific one, visit our Help Center.
Dashboards
This gadget appears in the following dashboard: Atlassian Marketplace Partner template (see Atlassian Marketplace Partner).
See also
- Atlassian Marketplace Partner template
- Vendor Cloud Cancellations
- Vendor Cloud Conversions
- App Cloud Conversions
- App Cloud Cancellations
- App Cloud Renewals
- Vendor Cloud Renewals
- Vendor Feedback
- App Feedback
- Evaluations by App
- App Aggregated Sales
- App Distribution Data
- Vendor Aggregated Sales
- Vendor Distribution Data
- Vendor Total Users