Created vs Resolved Requests
Overview
When your customers are creating more requests than the ones the teams can resolve, your queues are creating a debt. And this debt means that requests take longer to be resolved, so it impacts in an increase of SLA breaches, bad reviews and customers less happy 😞
This gadget is multi-project, so you can report across your whole portfolio of projects
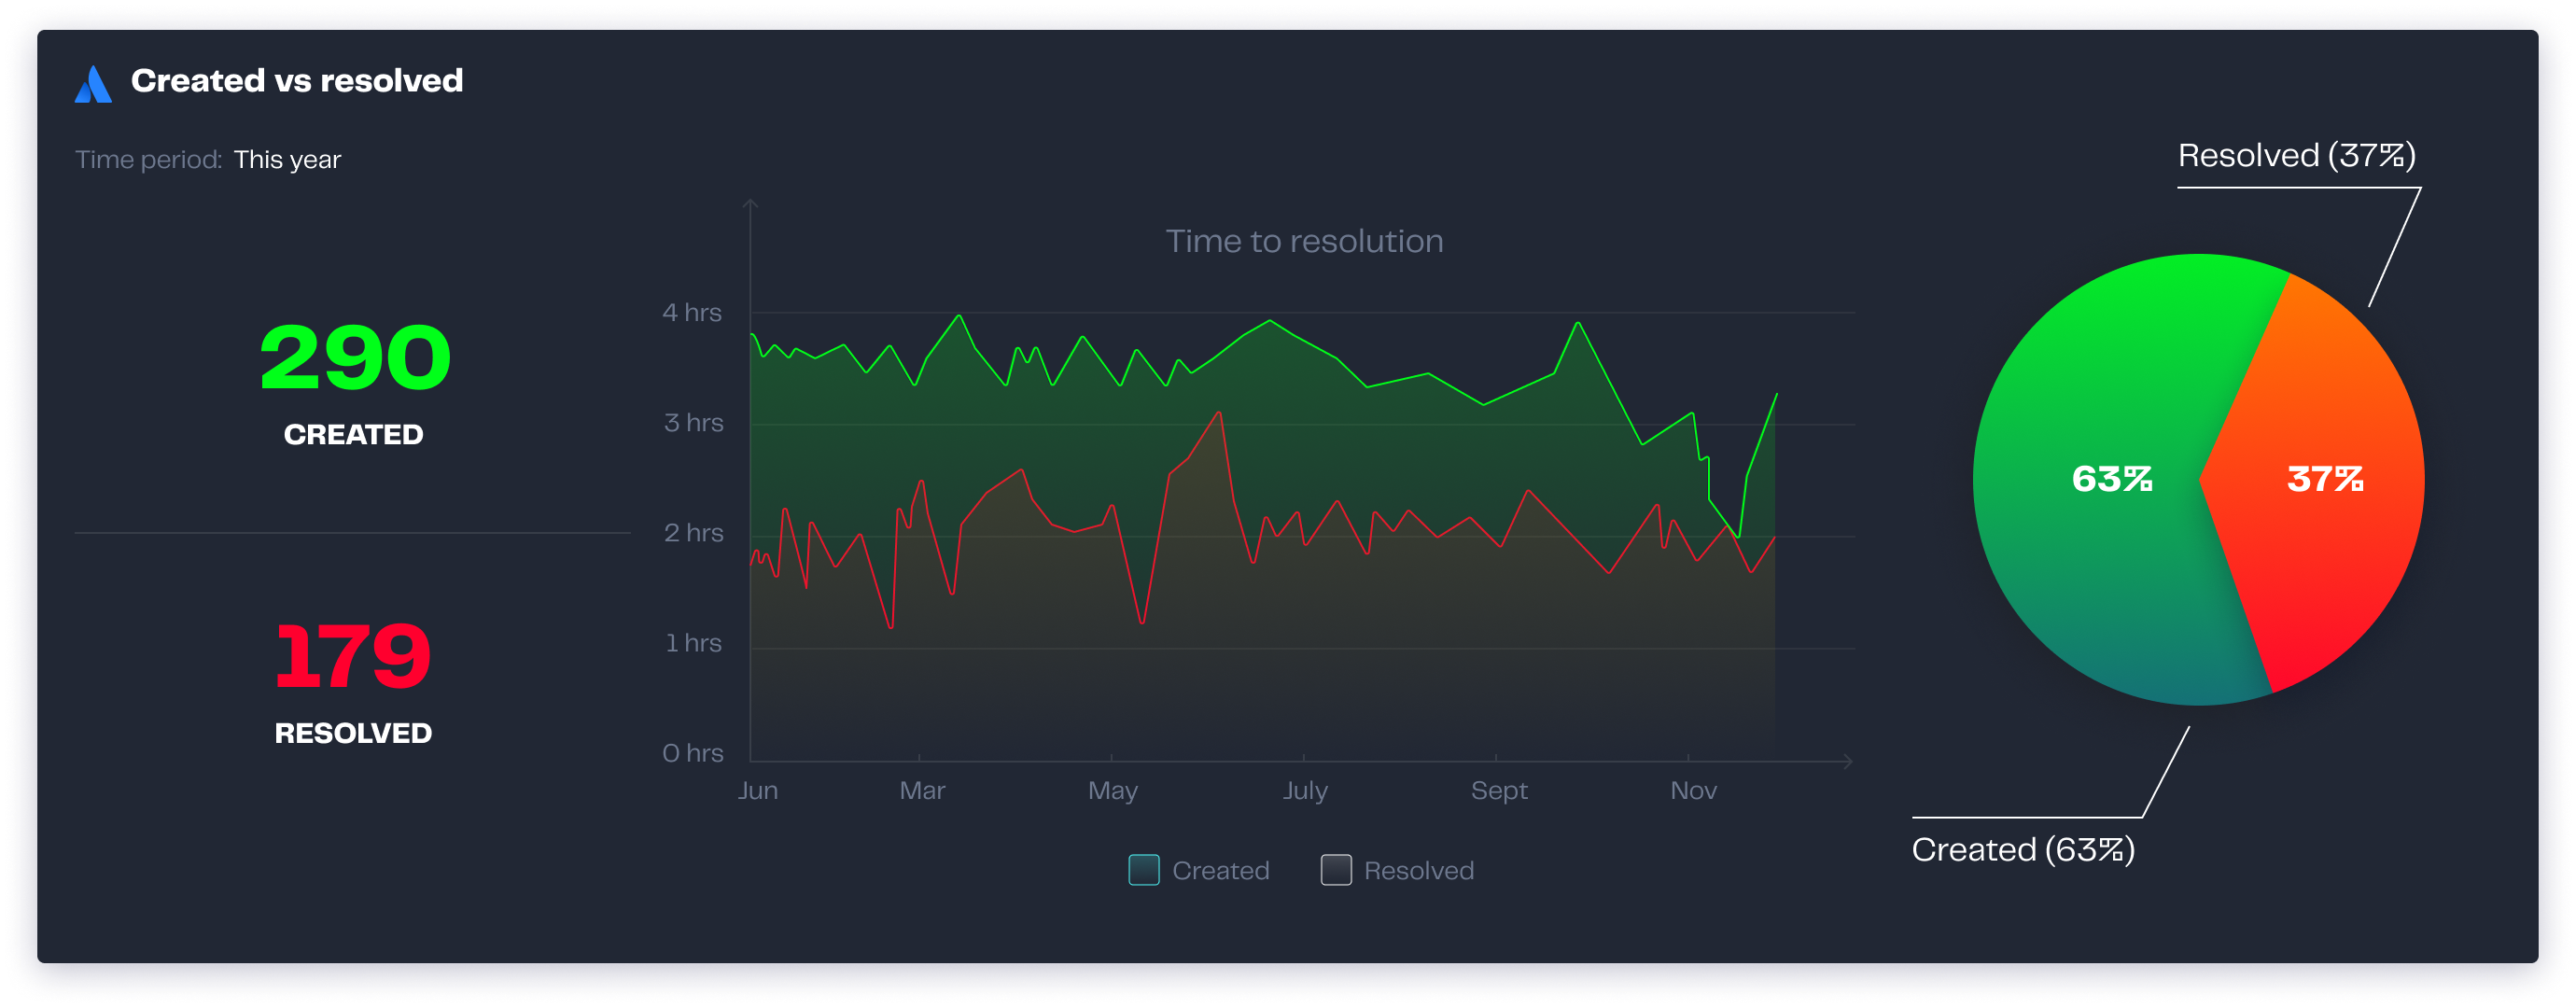
This gadget displays the number of requests created and resolved from specific queue of your service desk over a period of time:
Total count of requests created and resolved.
A graph with the timeline of requests created and resolved. When the red line grows higher than the green, it means that customers are creating more requests than the team is getting resolved.
A pie chart comparing the percentages of created vs resolved.
Configuration
Name your gadget meaningfully, so everyone knows at a glance what it is about and when to use it. Fill out the rest of the fields as applicable, namely:
The datasource, where Current indicates the Jira Service Management instance where the app is installed.
The projects and the queues where the requests are.
The period of time you want to display statistics of the requests.
Finally, indicate if you want to use the current settings for all the compatible gadgets in the dashboard. This option eases the pain of configuring one by one the rest of the gadgets with the same default configuration
Integrations
:jira_service_management:
We are working on our growing catalog of Dashboard Gadgets: KPIs and Metrics and Dashboard Integrations: Supported Products, but contact us you want us to expedite a specific one, visit our Help Center.
Dashboards
This gadget appears in the following dashboard: IT Service Management Team template.