SLA by Project
Overview
A Service Level Agreement (SLA) is a contract for your customers, where you basically set the goals for how fast you will manage customer requests. And a good service is driven by these goals, used to measure the level of your service. When you have several service management projects, it is useful to see a comparison between the different metrics in different projects with the same SLA as the baseline. So you can easily track through the whole organization how well or bad you are meeting your SLA
This gadget displays information about a specific SLA in service management projects during a specific period of time.
The SLA reports reflect 100% met when no requests are opened during the reported time period. This fixes two issues with Jira Service Management reports (Cloud JSDCLOUD-10282 and for Data Center JSDSERVER-5453)
For the selected period of time, where:
The SLA section: SLA Met. The % of those requests that met the selected SLA.
The Requests section:
Created requests. All the new requests created in that service management project during that time.
Resolved requests. All the resolved requests in that service management project during that time.
The Open section: Lists the requests count of the issue types in those projects.
In the right part of the gadget, the grand totals of created and resolved requests for all the projects in the specified period of time.
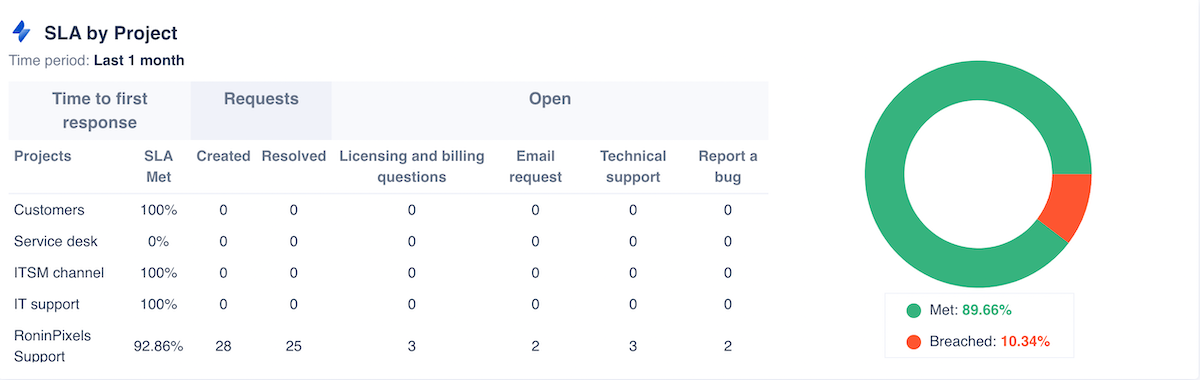
The donut chart represents the % of total requests either met or breached of all the projects. A project could indicate 100% met with 0 requests and other indicate 100% met with 50 requests. The percentage in the chart will take into account the total number of requests across all projects.
Configuration
Name your gadget meaningfully, so everyone knows at a glance what it is about and when to use it. Fill out the rest of the fields as applicable, namely:
The datasource, where Current indicates the Jira Service Management instance where the app is installed.
The SLA you want to track across all your projects.
The period of time you want to display the requests (when they were created and/or resolved).
Finally, indicate if you want to use the current settings for all the compatible gadgets in the dashboard. This option eases the pain of configuring one by one the rest of the gadgets with the same default configuration
Integrations
:jira_service_management:
We are working on our growing catalog of Dashboard Gadgets: KPIs and Metrics and Dashboard Integrations: Supported Products, but contact us you want us to expedite a specific one, visit our Help Center.
Dashboards
This gadget appears in the following dashboard: IT Service Management Team template.