SLA Accomplishment
Overview
Service management teams work on organizations' service level agreements (SLAs) basis, and means to easily spot SLAs breaches are required. We already saw gadgets for the two most common SLA metrics: Time to Resolution and Time to First Response, but different teams have different SLA metrics.
This gadget is multi-project, so you can report across your whole portfolio of projects
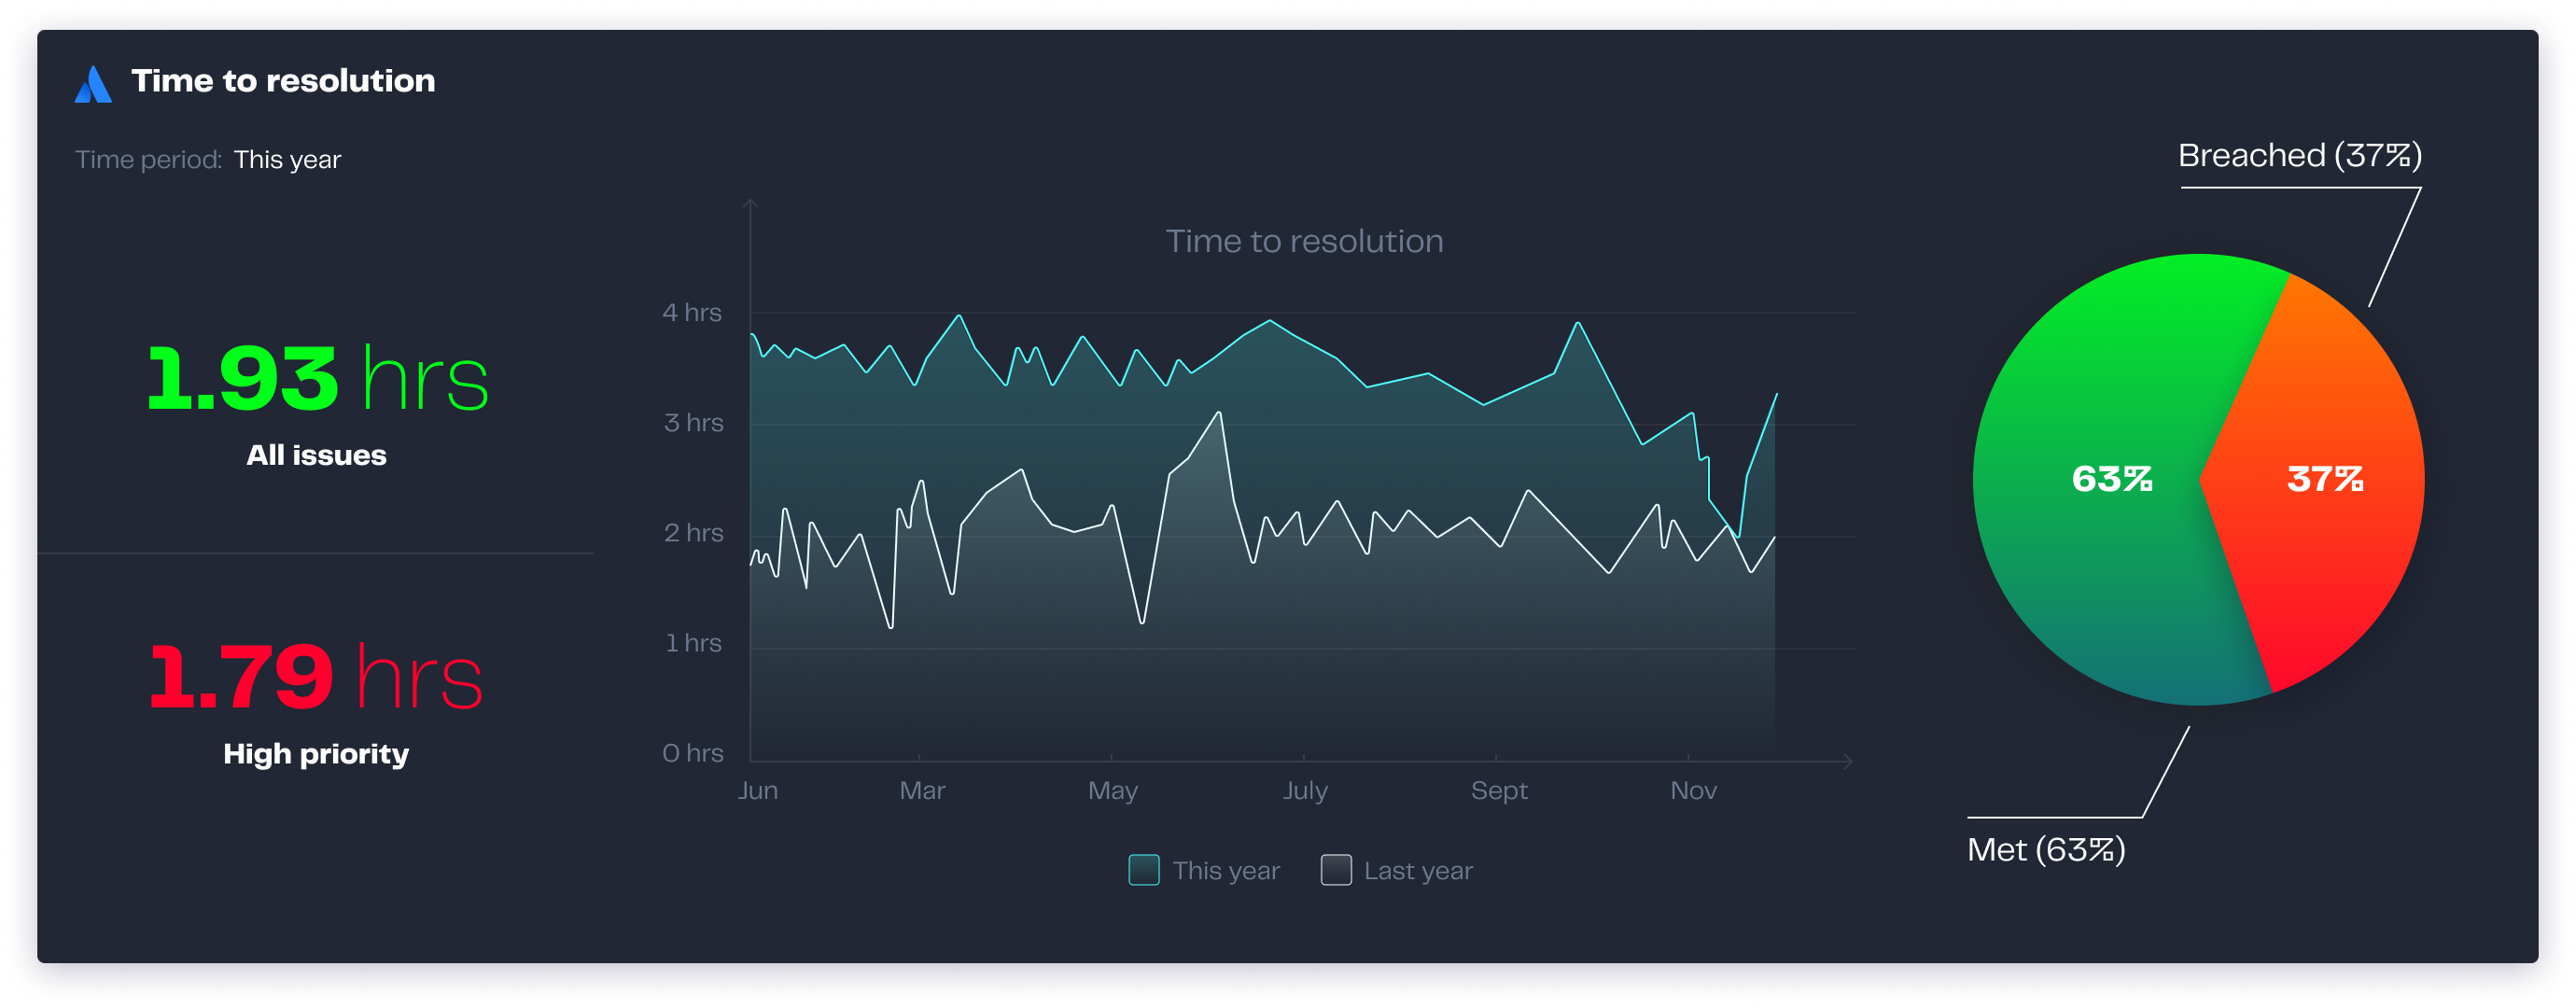
This gadget displays the average time of a given SLA over a period of time. It highlights the breached (and met) percentage of those requests over the selected period of time. Hover the graph series line to see the average time for all issues for each day.
Configuration
Name your gadget meaningfully, so everyone knows at a glance what it is about and when to use it. Fill out the rest of the fields as applicable, namely:
The datasource, where Current indicates the Jira Service Management instance where the app is installed.
The projects and the queues where the requests are.
The period of time you want to display in the time series of the graph.
The SLA to display the data from.
Finally, indicate if you want to use the current settings for all the compatible gadgets in the dashboard. This option eases the pain of configuring one by one the rest of the gadgets with the same default configuration
Integrations
:jira_service_management:
We are working on our growing catalog of Dashboard Gadgets: KPIs and Metrics and Dashboard Integrations: Supported Products, but contact us you want us to expedite a specific one, visit our Help Center.
Dashboards
This gadget appears in the following dashboard: IT Service Management Team template.