Service Desk Queue
Overview
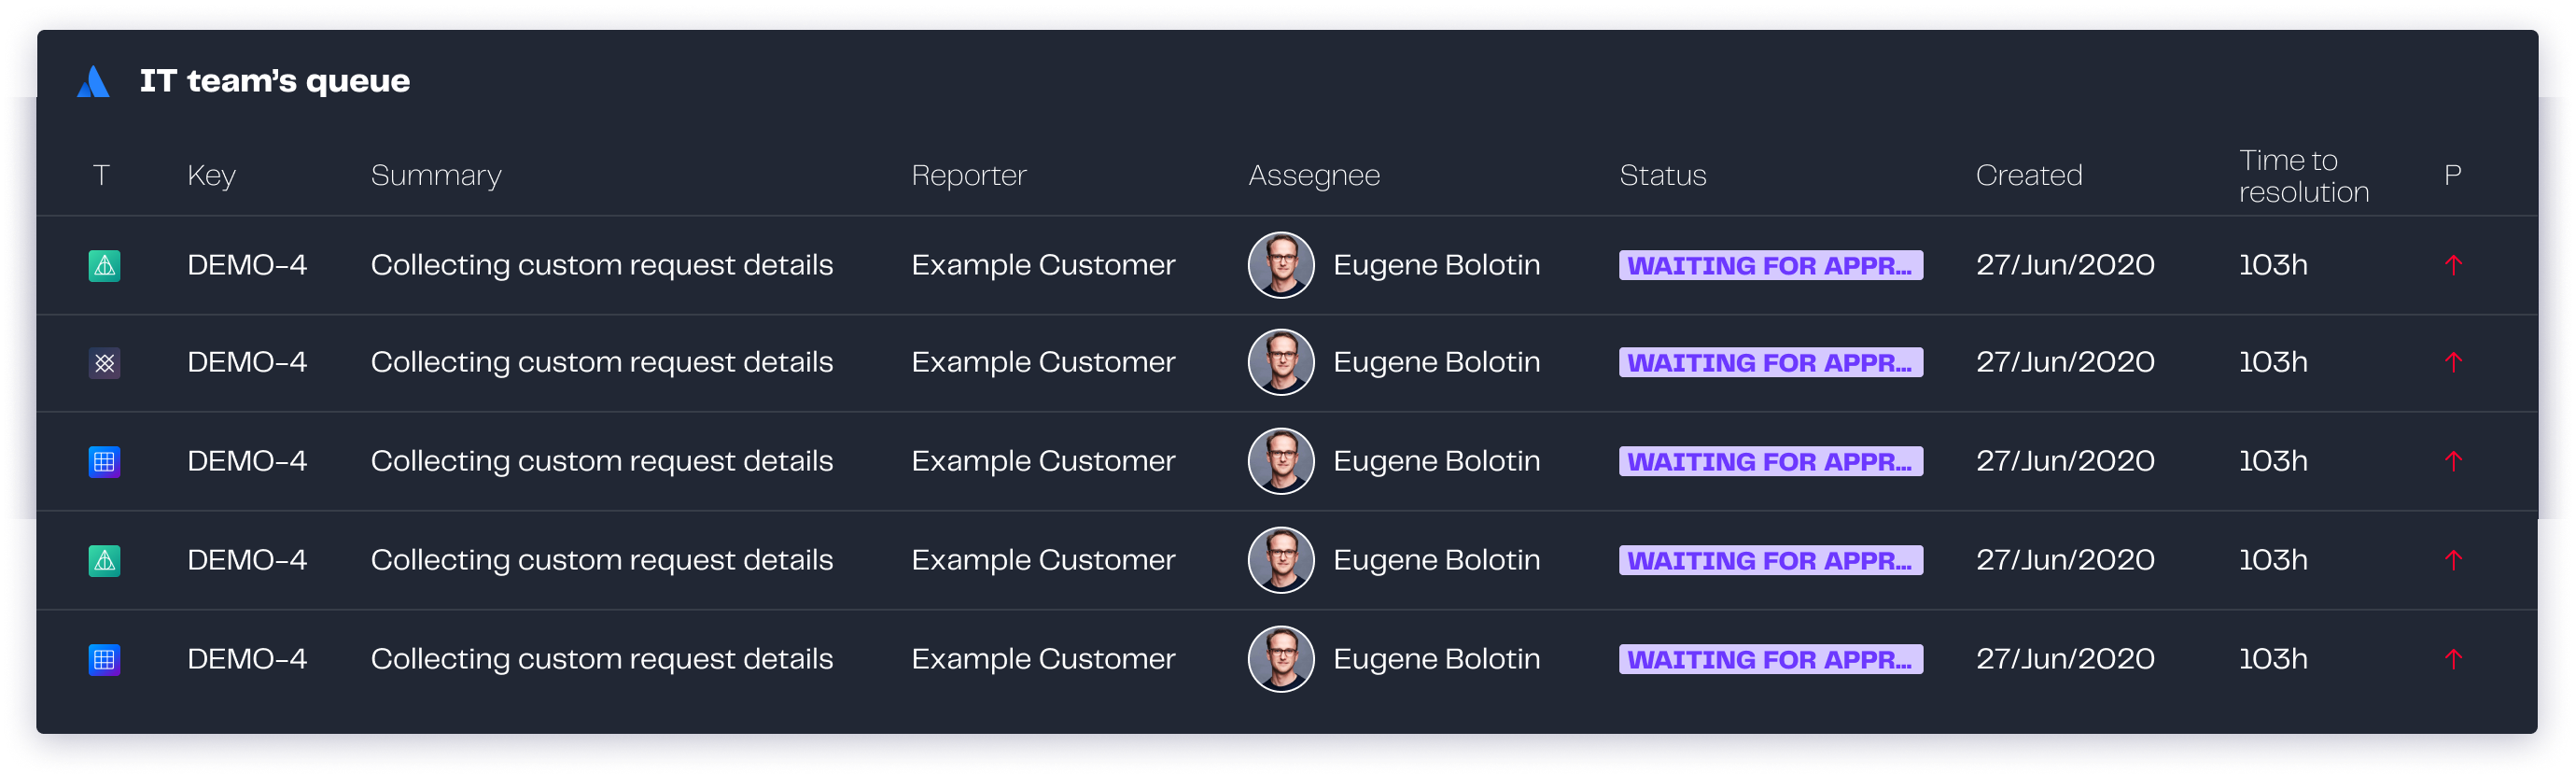
Queues are where the service desk team will spend most of their time, where the requests are triaged and prioritized. Queues also provide key information on issues, like the summary, status, customer, and very important, times. Times (spent, to first response, etc.) make us keep the focus, so SLAs are not breached.
This gadget displays a specific queue with the important information for each request. Visualizing a queue helps to align your team’s goals and acts as a to do list.
Configuration
Name your gadget meaningfully, so everyone knows at a glance what it is about and when to use it. Fill out the rest of the fields as applicable, namely:
The datasource, where Current indicates the Jira Service Management instance where the app is installed.
The project and the queue where the requests are.
The period of time you want to display in the time series of the graph.
Finally, indicate if you want to use the current settings for all the compatible gadgets in the dashboard. This option eases the pain of configuring one by one the rest of the gadgets with the same default configuration
Integrations
:jira_service_management:
We are working on our growing catalog of Dashboard Gadgets: KPIs and Metrics and Dashboard Integrations: Supported Products, but contact us you want us to expedite a specific one, visit our Help Center.
Dashboards
This gadget appears in the following dashboard: IT Service Management Team template.