Customer Satisfaction
Overview
A way to assess how the team is performing is by sending a survey to customers when a request is resolved. Then, review their comments and ratings to understand what went well, what went bad, and then improve the your service levels.
This gadget is multi-project, so you can report across your whole portfolio of projects
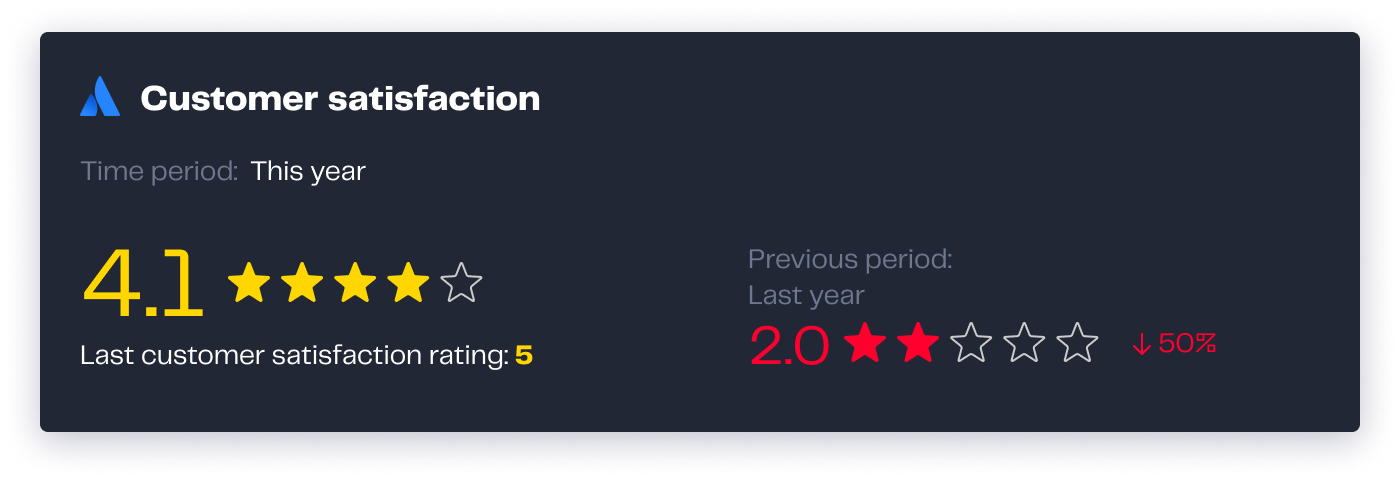
This gadget displays the customer satisfaction average rating in a period of time, together with the last customer satisfaction rating. It also displays a comparison with the previous period of time, to quickly evaluate if the team is doing better or need improvement.

Configuration
Name your gadget meaningfully, so everyone knows at a glance what it is about and when to use it. Fill out the rest of the fields as applicable, namely:
The datasource, where Current indicates the Jira Service Management instance where the app is installed.
The projects and the queues where the requests are. Double check that you select a queue that displays close issues, since the customer satisfaction feedback survey (CSAT) is sent when the issues are resolved.
The period of time you want to display the customer satisfaction ratings.
Finally, indicate if you want to use the current settings for all the compatible gadgets in the dashboard. This option eases the pain of configuring one by one the rest of the gadgets with the same default configuration
Integrations
:jira_service_management:
We are working on our growing catalog of Dashboard Gadgets: KPIs and Metrics and Dashboard Integrations: Supported Products, but contact us you want us to expedite a specific one, visit our Help Center.
Dashboards
This gadget appears in the following dashboard: IT Service Management Team template.